Monthly oil output in the U.S. this year topped 10 million barrels a day for the first time since 1970, hitting all-time records. And the surge has just begun.
On March 5, the International Energy Agency (IEA) released its forecast that predicted U.S. shale output would rise by 2.7 million barrels a day to 12.1 million barrels per day by 2023. As the IEA’s executive director, Fatih Birol said in a statement, “The United States is set to put its stamp on global oil markets for the next five years.”
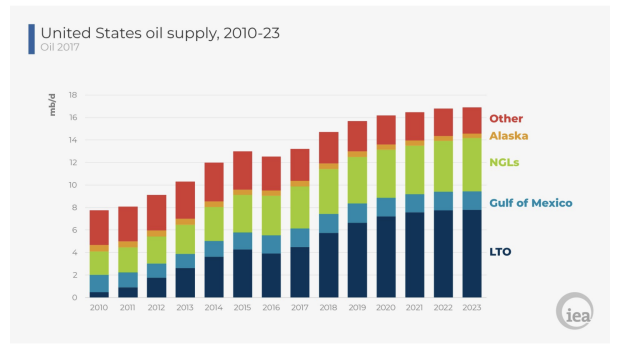
(Of that 16 million in 2023 the IEA projects that 12 million will come from shale)
U.S. Oil Exports
Importantly, Birol expects U.S. oil exporting capacity to more than double over the next five years from 1.9 million barrels late last year to 4.9 million barrels per day by 2023. That’s a good thing. Let me explain…
First, additional domestic demand for shale (mainly from the petrochemicals industry) will be around 900,000 barrels a day, according to an estimate from the energy research firm Wood Mackenzie. That’s not close to sopping up the extra oil produced.
An even bigger factor is the U.S. oil refining system, which was built many years ago. It runs much more efficiently on a steady diet of heavier, more sulfurous oil such as oil that comes from many OPEC countries. U.S. shale oil is mostly a light, ‘sweet’ crude oil variety.
Bottom line – a lot of the additional oil produced must find a market overseas, such as Europe or China. That’s just another reason a trade war is not a good idea. And why it was a good idea to remove the decades-old restriction on the export of U.S. crude oil in late 2015. U.S. exports of crude oil and petroleum products climbed more than 1.7 million barrels per day between December 2016 and December 2017 to a record 7.3 million barrels a day.
A key and often overlooked component to the expected surge of exports of U.S. shale oil is infrastructure. Important pieces of the needed infrastructure are our ports. One such facility is the Louisiana Offshore Oil Port (LOOP), which has been converted from a massive import facility. Just last month it test-loaded an oil supertanker for the first oil exports in its 37-year history.
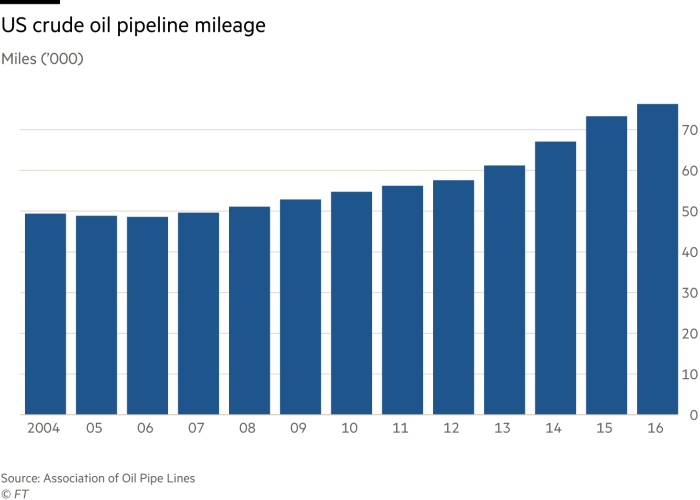
Other pieces of our crucial energy infrastructure are our pipelines. It is this crucial infrastructure that gives U.S. oil exports a structural advantage by cutting the cost of moving oil from the oil fields to ports. For example, the price difference between oil sold at Midland, Texas, in the middle of the prolific Permian Basin, and equivalent grades of oil on the Gulf Coast have narrowed from more than $30 a barrel in 2012 to just $3 as new pipeline flows have come onstream.
Oil Pipelines Point South
The U.S. pipeline infrastructure is undergoing a drastic change at the moment as the focus shifts to delivering as much shale oil as possible to Gulf of Mexico terminals so that it can be exported. These changes involve the reversal of flow in existing pipelines as well as the building of new pipelines.
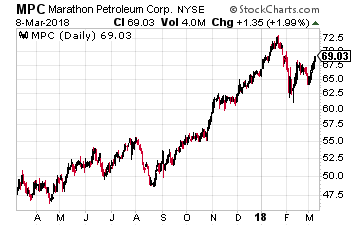 An example of the first type of change is the 1.2 million barrel a day Capline pipeline that is owned by Marathon Pipe Line LLC, a unit of Marathon Petroleum (NYSE: MPC). In 1967, this pipeline began to ship imported oil northward from the Gulf Coast to Illinois and from there oil was dispensed to a number of Midwestern refineries.
But now, thanks to shale oil, that is no longer necessary and the flow has nearly dried up. But instead of shutting down the pipeline, Marathon is proposing to simply reverse the flow and send crude from places like North Dakota’s Bakken to reach Gulf Coast ports for export.
Of course, the most prolific field at the moment is the Permian Basin in Texas and New Mexico. Brand new pipelines – the BridgeTex, Permian Express and Cactus pipelines – now connect the Permian to the ports of Houston and Corpus Christi. The respective owners of these pipelines are:
- BridgeTex is owned 50/50 by Magellan Midstream Partners L.P. (NYSE: MMP) and Plains All American Pipeline L.P. (NYSE: PAA).
- Permian Express is controlled by Permian Express Partners, which is owned 85% by Energy Transfer Partners (NYSE: ETP) (after its merger with Sunoco Logistics Partners in April 2017) and 15% by Exxon Mobil (NYSE: XOM).
- The Cactus pipeline is owned by the aforementioned Plains All American Pipeline.
And more pipelines are on the way. The energy consulting firm RBN estimates that a number of midstream projects (such as the Epic Pipeline, funded by private equity firm Ares Capital) could add 2 million to 2.1 million barrels a day in pipeline takeaway capacity from the Permian Basin. RBN believes that is “likely more than enough” to accommodate growing oil output from the Permian for the next five years.
Oil Pipeline Investments
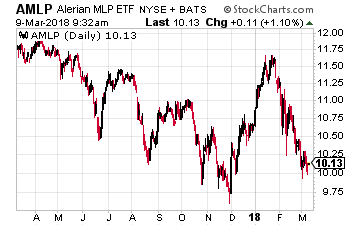 Yet, despite all of this good news regarding the critical role pipelines play in the U.S. shale oil boom, the stocks of pipeline companies have been chronic underperformers. When U.S. oil prices collapsed from $100 a barrel in mid-2014 to a low of $26 a barrel in February 2016, the Alerian MLP index of pipeline companies (NYSE: AMLP) fell 60%. Oil has since more than doubled but the index has recovered only 27% as investors seem not to believe the recovery story.
This is understandable. Many energy master limited partnerships (MLPs) shifted towards financing growth from internal cash flow instead of raising money from capital markets. This policy resulted in slashed dividends – distributions grew by an average of only 1.5% in 2017 among the companies in the Alerian index. That was well below the 10-year average of 5.1%.
But still, with sentiment so low, I see the sector as a contrarian investment for you and one that is ripe for a rebound. The fund management company Pimco agrees with me. In a recent note to clients, it argued that by reducing dividends and leverage, the energy limited partnerships have been “healing” and their equity valuations “represent an overly negative outlook on the sector”.
My colleague Tim Plaehn writes about these energy MLPs quite often, so I urge you to check out his articles. But here are a few beaten-down ones that caught my eye.
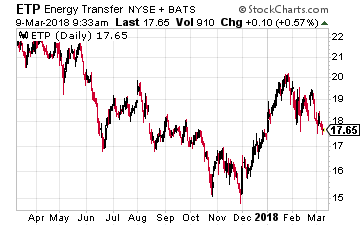 The first MLP on my list is Energy Transfer Partners, with its wide geographic spread of pipelines. It should now begin reaping rewards from its major projects including Rover Pipeline, Bakken Pipeline and Permian Express 3. And its merger with Sunoco should lead to $200 million of cost savings by 2019. I also like its increasing cash distribution, which showed a year-over-year jump of over 40% in the recent quarter.
It still has a large amount of debt, but with the stock down more than 28% over the past year (though it’s little changed this year) it now may be worth your time to take a look.
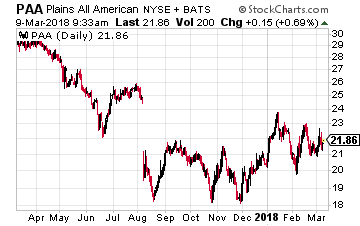 The second MLP on my list is Plains All American, whose shares have fallen by nearly a third in the last year, but are up about 5% so far in 2018. The uptick may be due to investors seeing that the company is modifying the way it manages inventory and is implementing provisions in the contracts it signs that should reduce chronic earnings volatility.
A plus this year is that a number of its pipeline projects have, or will very soon, come online. These include the extensions of its Diamond Pipeline and BridgeTex Pipeline, which will be put into service during the first quarter of 2018. The company’s STACK JV Pipeline in already in service and the Cactus Pipeline project was completed at the end of 2017. Its Sunrise Pipeline Extension, approved during the third quarter of 2017, is expected to come online during the first half of 2019.
These pipeline additions should also add more stability to its earnings, again making it worthy of consideration by you.
Finally, for the broadest exposure, there is the aforementioned ETF (AMLP). But I personally prefer buying specific companies in this case.
Buffett just went all-in on THIS new asset. Will you?
Buffett could see this new asset run 2,524% in 2018. And he's not the only one... Mark Cuban says "it's the most exciting thing I've ever seen." Mark Zuckerberg threw down $19 billion to get a piece... Bill Gates wagered $26 billion trying to control it...
What is it?
It's not gold, crypto or any mainstream investment. But these mega-billionaires have bet the farm it's about to be the most valuable asset on Earth. Wall Street and the financial media have no clue what's about to happen...And if you act fast, you could earn as much as 2,524% before the year is up.
Click here to find out what it is.
Source: Investors Alley