All posts by Jay Soloff

Jay Soloff is an options analyst with Investors Alley. Jay was previously the Chief Options Strategist at Hyperion Financial Group where he was the editor for over six years of several successful options newsletters. Prior to joining the online investment world, Jay was a floor trader and market maker on the CBOE, the world's largest options exchange. His experience includes trading a multi-million dollar options portfolio in equities options as well as serving as a consultant to Wall Street options trading groups. Jay also spent time as a senior analyst at a hedge fund of funds, where he analyzed professional options funds as well as traded option strategies for hedging purposes. All told, Jay has 20 years of options trading experience. He received his undergrad degree in Economics at the University of Illinois - Champaign, and his MBA and Master of Science in Information Management from Arizona State University.

Cash in on Lyft’s Big Moves (either way) With This Simple Option Trade

Whether or not it’s worth investing in IPOs always seems up for debate. It almost certainly varies from company to company. However, one thing that most investors agree on is that IPOs are interesting to talk about and can be fun to follow.

After several mostly dull years on the IPO front, 2019 seems like it could be quite a bit more interesting. We’ve already had Levi Strauss (LEVI) and Lyft (LYFT) come out with big IPOs. We could have Uber and Pinterest in the near future. Later in the year, we may get Airbnb, WeWork, Slack, and perhaps others. That’s quite a year for IPOs.

Trading IPOs is nothing if not exciting – especially once the options are listed. That’s not to say that every IPO has multiple large magnitude moves after launching. But, IPOs where there’s no consensus agreement on the valuation can certainly have their share of volatility.

This often takes place with companies which aren’t earning profits but have spent a ton of money already (in expenses). When the stock price is based entirely on future potential, opinions will vary greatly. How do you price hype?

We’ve seen this situation play out with LYFT. The ride share company is one of two huge players in the space – the other one being Uber. The growth potential in the ride sharing space is vast. However, the company also has net losses of over $900 million.

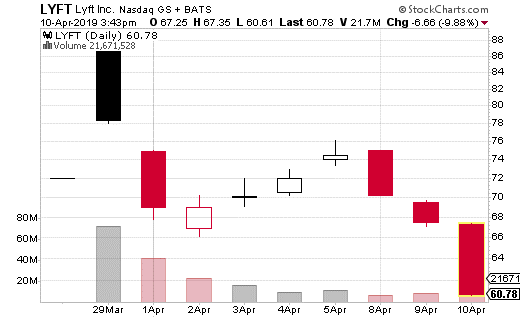
LYFT’s IPO price was $72, and it quickly climbed to as high as $88 on the day of the launch. However, the hype didn’t take long to fade, and the stock price quickly dropped below the IPO price. As I write this, the share price is all the way down to about $61.

So, how do you trade a stock like Lyft with options? Can you take advantage of all the volatility? Is it worth the risk?

At least one options trader thinks so. This trader purchased a straddle in LYFT, which makes money if the stock moves far enough either up or down from the strike price. By the way, a straddle is simply buying a call and put at the same strike, in the same expiration.

In this case, the trader purchased the May 10th 68 straddle in Lyft, with the stock price right at $68. Most of the time, you’ll see the straddle purchased at the strike that is closest to the actual price of the underlying stock, also know as the at-the-money strike.  

The cost of the straddle (the combination of the 68 call and put) was $9.53, which is certainly expensive. Of course, that’s what you’d expect from a stock that moves as much as Lyft has so far. The breakeven points for the trade are roughly $58.50 and $77.50. So, if the straddle moves beyond those points (and it’s currently already most of the way towards the lower the number) then the trade profits.

About 250 straddles were purchased, so each dollar above or beyond the breakeven points will generate $25,000 in profits. However, the trader paid over $250,000 for these straddles and that premium is at risk the closer the stock closes to $68 at expiration.

So – should you make a straddle trade in Lyft? Well, in this case, it looks like it was a successful gamble. You could still pay about $950 per straddle at whatever the current at-the-money strike is, but that’s clearly a lot of money to spend on one spread (strategy).

On the other hand, Lyft has been sufficiently volatile to justify the price of the straddle so far. I wouldn’t make a habit out of trade like this, but doing a small amount (like 1 or 2 straddles) in a situation like this will likely work out in the short-term. The risk is certainly high due to the cost, but the rewards may also be substantial.

For those curious, professional options traders may make a trade like this, but they’d hedge it with shares of LYFT. It’s a strategy called gamma scalping. It can work really well when there’s volatility, but can be costly and requires you to be at your screen for most of the trading day.

Source: Investors Alley

  [FREE REPORT] Options Income Blueprint: 3 Proven Strategies to Earn More Cash Today Discover how to grab $577 to $2,175 every 7 days even if you have a small brokerage account or little experience... And it's as simple as using these 3 proven trading strategies for earning extra cash. They’re revealed in my new ebook, Options Income Blueprint: 3 Proven Strategies to Earn Extra Cash Today. You can get it right now absolutely FREE. Click here right now for your free copy and to start pulling in up to $2,175 in extra income every week.

Want to Make a Big Bullish Bet On Facebook Ahead Of Earnings?

It’s undoubtedly been a good year for stocks, with the S&P 500 up almost 15% year-to-date. But, it’s been an even better year for the oft-embattled tech giant, Facebook (FB). Shares in the omnipresent social media company are up 33% so far this year.

FB has taken quite a beating over the last year on user privacy concerns and other regulatory issues. The company has dealt with issues ranging from not doing enough to curb election interference to promoting hate speech to selling user data to dubious third-party vendors. Moreover, there are growing calls by government officials to break up FB and its alleged monopoly power in the social media space.

Cleary, there has been plenty of bad news in recent months. As such, investors have to be pleased with the year-to-date results of FB stock taking everything into consideration. But, can the current bullish trend continue? And what about all the concerns from the previous year?

First off, I don’t think FB is in any real danger of getting broken up. I believe it would be very difficult to prove monopoly power for a company like Facebook, which technically has plenty of substitutes and competition out there.

On the other hand, other regulatory and privacy concerns are still an issue. FB is attempting to get in front of these issues (after months of criticism). However, the company still has a lot of work to do to improve the massive hit to its reputation.

Nevertheless, FB still has plenty of growth potential. That’s mostly because Instragram is still extremely popular, along with WhatsApp. Both platforms were acquired by Facebook and have continued to thrive and grow.

In fact, an analyst thinks Instragram’s new e-commerce service could produce $10 billion in revenues by 2021. That’s obviously music to the ears of current investors, who saw the shares gain over 3% when the analyst comment hit the wire.

Options action on FB has been plenty bullish as well. The last week of options activity has been roughly 70% bullish. Earnings are due during the first week of May, but many of the large trades I’ve seen expire in April. So, it wouldn’t be a shock to see the share price climb into next month’s earnings.

One trade in particular was about as bullish of a trade as is possible with options. This trade, called a risk reversal, has the strategist selling puts to finance a call purchase. Downside risk is precarious below the short put strike, but upside gain potential is enormous.

This particular trade expires April 18th and involved selling the 162.5 put and buying the 177.5 calls with the stock at about $174. The trade cost $1.42 and was executed about 1,000 times (for a total cost of about $150,000). That makes the breakeven point just below $179.

The 162.5 put was sold as a way to lower the price of the call, which would have cost nearly $2.00 without the proceeds from the short put. However, in return, the trader could lose $100,000 per $1 move below the put strike plus the premium cost of the trade.

Conversely, the trade generates $100,000 per $1 move above the breakeven point. By the way, that breakeven point of $179 is much closer to the price (about $174) than the short put strike. If FB closes in between the strikes at April expiration, the trade only loses the premium paid.

Still, this is clearly a very bullish trade over the next two weeks. There is quite a bit at stake using a risk reversal, so the trader clearly has a strong opinion on FB’s upside potential.

Now, most people shouldn’t mess with risk reversals, which are mostly used by professional traders. Instead, you can make a bullish trade on FB with limited risk over the same period by using a vertical call spread.

For instance a similar bullish trade for April 18th would be buying the 177.5 strike call and selling the 182.50 strike call. The trade only costs $1.25 and that’s all you are risking. The gains are capped at $3.75, which is still 300% return potential. That’s not bad for a trade with clearly defined and limited risk.

  [FREE REPORT] Options Income Blueprint: 3 Proven Strategies to Earn More Cash Today Discover how to grab $577 to $2,175 every 7 days even if you have a small brokerage account or little experience... And it's as simple as using these 3 proven trading strategies for earning extra cash. They’re revealed in my new ebook, Options Income Blueprint: 3 Proven Strategies to Earn Extra Cash Today. You can get it right now absolutely FREE. Click here right now for your free copy and to start pulling in up to $2,175 in extra income every week.

Source: Investors Alley

Option Traders Make a Massive Bullish Bet on This Transportation Play

It is nearly impossible to overstate how valuable options can be for traders. The benefits to using options for trading are numerous and straightforward. In many cases, the more traders get used to using options, the more they realize how beneficial they can be.

For example, traders will often begin experimenting with options because of the leverage they provide. Having 1 option equate to control of 100 shares of stocks can certainly lead to greater returns than simply using stocks.

However, options leverage is more than just increasing returns. The leverage component also means traders can trade stock they may not normally be able to afford. Take Amazon(AMZN) for example. It’s nearly an $1,800 stock. With options, you could conceivably control 100 shares ($18,000 worth) of AMZN for a few hundred dollars.

Options can also provide access to strategies traders may not normally be comfortable with, such as short selling stock or trading commodities. Using options can make these strategies simpler and safer than they’d otherwise be.

But options can provide other benefits above and beyond how they’re used in trading. In fact, studying the options market and following options action can be highly instructive and rewarding.

Big investment firms, funds, and trading desks will often use the options market to establish their positions in stocks and ETFs. Traders can often get an idea of what the smart money is doing by following big, block trades in options.

Sometimes, block trades will occur in stocks you’ve never heard of or that rarely trade in big volume. These situations can be particularly useful. Not only are they easier to spot among the noise of everyday trading, but it can often be easy to tell what the goal of the trader is.

For instance, let’s look at a large block trade in Knight-Swift Transportation (KNX). The trucking and transportation company trades about 2.5 million shares a day on average, but only about 2,000 options. So, when a massive options trade hits the wire in this name, it can be an eye-opener.

This particular block was a trader buying 20,000 August 35 calls for $2.35 per contract with the stock trading at $32 per share. What this means is that KNX needs to be at $37.35 or above by August expiration for the trade to break even.

The trader is spending $4.7 million for this trade, which is the max loss potential. So, this clearly is a very bullish trade and the strategist is risking a lot on the call purchase. After all, we’re talking about over a $5 move higher (over 15%) in a stock that doesn’t make big moves all that often.

On the other hand, the trade will generate $2 million for every dollar the stock moves higher than the breakeven point. In other words, there is some substantial upside to this strategy. And, it isn’t likely someone is dropping nearly $5 million on calls on a whim.

This is exactly the sort of situation where copying the trade is a reasonable strategy. KNX options don’t trade that much and a straight up call trade is pretty transparent. Someone thinks this stock is going up in the coming weeks. And, for about $250 – $300 you could control 100 shares of KNX for about 5 months.

  [FREE REPORT] Options Income Blueprint: 3 Proven Strategies to Earn More Cash Today Discover how to grab $577 to $2,175 every 7 days even if you have a small brokerage account or little experience... And it's as simple as using these 3 proven trading strategies for earning extra cash. They’re revealed in my new ebook, Options Income Blueprint: 3 Proven Strategies to Earn Extra Cash Today. You can get it right now absolutely FREE. Click here right now for your free copy and to start pulling in up to $2,175 in extra income every week.

Using Options to Trade the Spike in Advanced Micro Devices

There are generally two reasons why a stock a sudden, big move. Either the overall market is having a big up or down day (the systemic effect). Or, the company itself has some specific news item causing a large move (the idiosyncratic effect). Most stock specific news is related to earnings or product announcements, although sometimes it can be something entirely random.

Sticking with the more standard explanations, we tend to see gap moves in stocks after a surprising earnings announcement or an unexpected product announcement. Earnings surprises are generally straightforward but product surprises are a different matter. What kind of product announcement can cause a stock to gap (usually higher)?

In most cases, a surprise product announcement is one that comes entirely out of left field. We’re not talking about the next edition of an iPhone, but instead the unveiling of an entirely new product line.

For a perfect example, look what just happened with Advanced Micro Devices (NASDAQ: AMD).

AMD is one of the biggest graphic card companies in the world (GPUs). The company’s Radeon line of graphics cards are particular prevalent in the gaming universe. The video game industry is huge and continues to grow as e-sports becomes a more mainstream phenomenon.

So, when Alphabet (NASDAQ: GOOGL) announced a new video game streaming platform called Stadia, it was huge news. What was even bigger news for AMD is that Google announced it would be using their GPUs to render the graphics for its new gaming system.

The response by investors was overwhelming positive for AMD – and why it shouldn’t it be? There’s a massive amount of potential with this service and it will clearly boost sales and profits for the company. In fact, the stock jumped 12% on the day of the announcement.

What’s more, bullish options action in AMD substantially increased. The 30-day average for bullish trades on AMD was at 60% of activity. But, the day of the announcement, bullish activity jumped to 76% of all options activity.

One strike and expiration which saw a lot of action in particular was the 27.5 strike expiring on April 5th. With the stock price around $25.50 about 2,000 of these calls were bought for about 40 cents. That’s a breakeven price of $27.90 for roughly a two-week trade.

The stock closed at $26 the day of the spike, so the trader clearly thinks the stock will keep running. The buyer is spending about $80,000 on this bullish trade, but could generate $200,000 per $1 above the breakeven price.

If you want to make a short-term bet on AMD continuing its climb, buying those short-term calls is a reasonable trade. However, you can also buy yourself more time without spending too much more in premium.

The April 18th 27 calls cost about $1 with the stock at $26. So, for a full month before expiration (and with the stock 50 cents higher and the strike 50 cents lower) you can spend $1 instead of $0.40. The breakeven point is still right around $28, but you have 2 additional weeks (and about 4 total weeks) for the trade to work.

That’s a reasonable tradeoff in my opinion and will give you a better chance to succeed if the stock keeps climbing. Given the massively bullish news, it certainly wouldn’t shock me if the stock takes a shot at $30 or above in the near future.

Gold Miners Could Be Ready To Run

One of the unsung stories of the last few months is the resurgence in gold prices. An ounce of gold has climbed from a low of about $1,200 in mid-November to over $1,300 as of this writing. That’s a pretty sizable jump in a relatively short amount of time.

There are a few reasons why gold may be on the move higher. At least part of it could be due to the amount of overall uncertainty we’ve seen this year – with plenty of unresolved issues remaining at the macro level. But perhaps more importantly, the Fed’s commitment to keeping interest rates low could lead investors to believe that inflation is going to surface anytime now.

Since gold is considered a decent hedge against inflation, it may be a big part of why the rally has occurred. (Gold is actually a better hedge against deflation than inflation, but generally speaking, uncertainty over future currency levels leads to more demand for gold).

Along with gold itself, gold miners have also benefited from the renewed interest in precious metals.

Related: Get Paid to Own Gold

VanEck Vectors Gold Miners ETF (NYSE: GDX) is a widely popular method for investing in gold miners. The ETF invests in the biggest gold miners that trade in the US and Canada. About 60% of the fund’s holdings are invested in the top 10 names in the industry.

GDX trades nearly 50 million shares a day on average – making it one of the most heavily traded ETFs. It also averages about 85,000 option contracts per day. Very few other ETFs or stocks can beat that average.

Gold miners have the advantage of tracking gold but also producing an income stream. That makes them a bit more palatable to many investors in comparison to the commodity itself. Not to mention, GDX even offers a dividend, something gold bullion can’t ever do.

A fund or well-capitalized trader just rolled out 10,000 GDX calls to May, suggesting gold miners could be in for a big rally over the next 3 months. The trade itself was the purchase of the GDX May 17th 22 calls for $1.22 with the stock trading at $22.15 per share.

At 10,000 contracts, it means the trader spent $1.2 million in premium, which is obviously a strong commitment to GDX’s upside. That’s because the premium is the max loss potential on the trade, so if GDX is under $22 at May expiration, the calls will be worth zero.

That sort of confidence in GDX’s upside also suggests that gold and gold miners are going to maintain the gains they’ve seen over the last month or so. Of course, the call buyer is looking for more than just sideways movement. For every dollar above the breakeven point of $23.22, the trade pulls in $1.2 million in profits.

If you’re bullish on gold miners, you could make this same trade. Or, if you want to save some money and do a similar trade, you could turn the trade into a call spread instead. With GDX trading at around $22, the 22-24 May call spread is trading for about $0.70.

That lowers the breakeven point to $22.70 and your max loss is down to $0.70 per spread. You max gain is capped at $24 or above in the stock, which is $1.30 after accounting for the cost of the spread. Still, that’s 186% potential gains for a relatively inexpensive trade that covers the next three months.

Using Covered Calls To Increase Your Return In Twitter

I’ve just returned from the Orlando MoneyShow and was very impressed at the amount of investors and traders looking to learn more about options strategies. I had the opportunity to deliver two different presentations to the options-oriented folks. One of the topics I spent quite a lot of time on was covered calls.

Of course, I’m a big fan of using covered calls whenever possible. But, it was nice to see that many in attendance also have tried the strategy or are interested in learnings more. I believe the more people know about the benefits of covered calls, the more popular the strategy becomes.

For instance, covered calls can often provide more steady returns from your portfolio. This consistency occurs because you are regularly receiving income from the calls you sell against the long shares you own. What’s more, the call premium can be used to offset some downside risk.

The combination of a regular income stream plus a built in hedge certainly has the effect of smoothing out the returns over time. Nobody likes inconsistent and choppy returns. It’s one of the reasons covered calls (aka buywrites) are so popular among institutions. The great things is, we can make the exact same buywrite trades as the institutions.

And don’t forget, using a covered call strategy does not preclude you from receiving a dividend. Since you are long the stock, you still get the dividend if you’re holding the shares when ex-divided comes around. Selling a call against long stock for income doesn’t impact the dividend at all – it just amplifies the yield.

Let’s take a look at a very interesting covered call I just came across in Twitter (NYSE: TWTR). TWTR is an immensely popular microblogging site which just sold off fairly sharply after earnings. The stock dropped from around $35 to $30, as you can see in the chart.

Now, TWTR isn’t a dividend paying stock, but it’s a great example of another way you can use covered calls – to earn income while you wait for stock appreciation. In this case, the covered call buyer is probably hoping for a short-term rebound in the shares.

The actual trade was buying 2,288,000 shares of TWTR versus selling the March 15th 34 call. Remember, one call needs to be sold for every 100 shares, so the call was sold 22,880 times for $0.41 per option. This was done with the stock price at $30.29.

With the covered call in place, the trader can make money all the way up to $34 in the stock price before the gains are capped due to the short call. Meanwhile, $938,000 in premium is collected regardless of what the stock does. That means the shares are protected down to $29.88 before any money is lost.

The premium collected represents a 1.4% yield for just over a month holding period. However, if the stock moves up to $34, the trader can earn another $3.71 on the trade, or an additional 12%. In dollar terms, that’s about $8.5 million of additional upside.

If you think this is a good entry point for TWTR, I believe this is a great trade to make. You are getting paid to wait for a rebound and not significantly reducing the amount of upside you can attain if the stock rallies. Plus, this trade would be very easy to roll out if the stock doesn’t rebound by March 15th.

Source: Investors Alley

A Bullish Bet On Netflix That Can Make 85% Gains

The FANG stocks can be quite polarizing for investors, and Netflix (NASDAQ: NFLX) is no exception. The streaming video giant (and the N in FANG) also may be the most volatile of the four. You can usually count on it for some action every few weeks or so.

Of course, NFLX just posted earnings so there was bound to be a lot of volatility associated with the event. But even before earnings, the stock had been plenty active. As you can see from the chart, there’s over a hundred point range in less than a month.

Last earnings period in 2018, NFLX beat earnings substantially. But, poor market conditions (and a high valuation) led to a steep decline in the share price. The drop ended and the reversal began right at the end of the year. Since that time, the stock has mostly gone straight up until just recently pulling back.

Along with momentum from the stock market recovery, NFLX headed higher in January due to higher viewership numbers. And then, the company announced it would be raising prices. Since NFLX appears to be a fairly inelastic good, most customers will continue their subscriptions after the price hike. That means a bigger bottom line for the company.

On the other hand, the recent earnings news wasn’t stellar. The results weren’t exactly disappointing, but they don’t blow away expectations either. And, the company’s high cash flow needs are a clear reason why raising subscription prices had to take place.

So what’s in store for NFLX next? Let’s take a look at the options action…

A well-capitalized trader just made an expensive bullish bet on NFLX that expires in April. The trader purchased the April 320-330 call spread (buying the 320 call and selling the 330 at the same time) for $5.40 with the stock price at $321.90. The trade was executed 2,680 times for a total cost of $1.4 million.

The cost of the trade, the $1.4 million in premium, is the max risk on the trade. The trade breaks even at $325.40, and can achieve max gain at $330 or above by April. The $4.60 in max gains translates to $1.2 million in profits, or 85% gains.

Now, it may seem like $1.4 million is a lot to spend to only make 85% – at least for a volatile stock like NFLX. However, keep in mind that the trade is already in the money. There’s $1.90 in intrinsic value already in the spread, so really the trader is only paying an extra $3.50 for the position. Moreover, being in the money substantially increases the probability of the trade’s success.

This is an expensive call spread on NFLX, but it has 3 months to expiration and is higher probability than most large call spreads you’ll see. If you are bullish on NFLX, this is a reasonable idea for a trade if you have a bit more money to spend on premiums.

Source: Investors Alley

Make This Trade The Smart Money’s Betting On

While stocks were likely oversold to end 2018, the action in January has been far more bullish than many expected.  It’s easy to say that there’s too much buying going on, just as many thought there was too much selling over the last three months of last year.

But, stocks have a way of moving in waves, especially when volatility is higher than normal.  We had a selling wave in December and now a buying wave in January.  Are we going to have another selling wave in February or is the rally going to continue?  Or, are we going to move sideways for a while?

Predicting market direction is never an easy task.  That’s true no matter how much experience you have, how advanced your research tools are, and how many resources you have access to.  There are simply too many variables to know for certain.

However, market volatility can be more predictable.  That doesn’t mean it’s easy to trade volatility or volatility products.  However, volatility models do tend to perform better when it comes to forecasting than directional models.

That means if I come across a big volatility trade (using ETFs or otherwise), I certainly pay attention to it.  Large volatility trades can give you a clue as to what the smart money is expecting, at least in terms of future market volatility.

Let’s take a look at a very interesting volatility trade that I recently came across in iPath Series B S&P 500 VIX Short-Term Futures ETN (NYSE: VXXB).

First off, VXXB is taking over for VXX, which expires at the end of January.  VXX is actually a note that had a 10-year life, which is about to end.  VXXB will replace VXX and will be the exact same thing. In fact, when VXX goes away, VXXB will drop the B and become the new VXX.

VXXB is the easiest way to trade volatility since it trades like a stock. It tracks the first two futures that make up the VIX calculation, so is representative of short-term volatility.

A sophisticated trader just made a ratio call spread trade in VXXB which I think is quite illuminating.  A ratio spread means the legs of the spreads aren’t all an equal amount, as you’ll see.  More specifically, with VXXB at $37.25, the trader bought the March 15th 38 call 5,000 times while selling the 43 call 10,000 times.

Because twice as many 43 calls were sold versus the 38 calls, the trade generates a credit of $0.80.  That means if VXXB is below $38 at March expiration, the trader earns $400,000.  What’s more, the trade can make additional money from $38 to $43, with max gain at $43.  In the best case scenario, the trader can make $2.5 million in appreciation plus $400,000 in credits for a total of $2.9 million.

The risk from the trade comes from the 10,000 calls sold at 43.  Only 5,000 of those are protected by the purchase at 38.  The other 5,000 are exposed to however high VXXB could realistically go.  The trade loses $500,000 per $1 in VXXB above $43.

This ratio call spread is interesting because it can be considered both bullish and bearish on market volatility. The credit aspect of the trade is moderately bearish or neutral on VXXB.  But, the long call spread feature is clearly bullish (but not too bullish).  But, the trader definitely doesn’t want to see a spike in volatility due to the unlimited loss potential on the upside.

Given the risk of the trade, the strategist making this trade clearly doesn’t believe volatility is going to spike and remained elevated prior to March expiration.  Still, this isn’t the sort of trade a casual trader should make.

Instead, stick to a straight 38-43 call spread in VXXB if you’re bullish on VXXB or want to hedge a long stock portfolio.  For those bearish on market volatility, you can use a put spread to take the opposite side for relatively cheap.

Source: Investors Alley

A Simple, Short-Term Hedge On Real Estate

Undoubtedly, most investors were hoping that the first rally of the New Year was going to stick around for more than just a few days. The jury is still out whether or not the market is going to continue its bearish trend. But, the surprising news from Apple (NASDAQ: AAPL) certainly casts a shadow over the brief glimmer of hope from investors.

In case you missed it, AAPL preannounced poor earnings based on slower than expected sales – primarily in China. The company lowered revenue guidance for the first time in 12 years and it sent a ripple through the markets. If one of the largest companies in the world is struggling, what’s that mean for everyone else?

It does seem to show that the trade/tariff war between the US and China is having real consequences on American companies. AAPL shares dropped 10% on the day after the announcement, with the S&P 500 pulling back 2.5%. Once again, that’s not the day bulls were hoping for after several up days in a row.

Given all the uncertainty in the market these days, it’s important for investors to understand the value of hedging. That is, every investor who owns stocks should know how to protect against downside risk. This includes those holding single stocks, ETFs, index funds, and other mutual funds.

Essentially, downside risk can be hedged with any asset that makes money as the market goes down. It’s a way to counter the losses you may incur from your long stock/fund positions. The easiest way to do this is with inverse ETFs and options.

Both inverse ETFs and options (long puts) are easy enough to implement as hedges. I’m going to focus on options in this article.

In most cases, simply buying a put option on the asset you want protected is all you need to do. A put option will only cost a fraction of the cost of the stock, so even if you lose money on the put (which is preferable) you won’t sacrifice your upside return all that much (in most cases). And since options use leverage, if your put pays off, it can cover most or all of your losses on the asset on a down move.

It’s easier to look at a hedge through an example. So here’s an actual hedge trade against real-estate stocks that recently hit the tape. By the way, that’s the beauty of an options hedge. You can pick the time frame you want, while protecting against any sort of asset class – as long as it has an ETF available (which is pretty much all of them).

The trade I’m referring to occurred in iShares US Real Estate ETF (NYSE: IYR). With IYR at $74, the trader purchased the January 11th 71.5 put for $0.32. This is essentially a one-week hedge that protects against the real estate ETF falling below $71 (technically $71.18 is the breakeven point).

The trader bought about 7,000 of these puts for roughly $220,000 in premium, which is also the max loss on the trade. However, if the market sells off sharply over the next week and takes real estate stocks down with it, the hedge will really pay off.

As a matter of fact, for every $1 below the breakeven point, the hedge will generate about $700,000. If you’re concerned about a short-term drop in real estate stock prices, this is a really good method of protecting your portfolio. Paying just $0.32 per option is a reasonable price to pay for downside protection for a week, especially given how volatile the market has been the last several months.

Apple (AAPL) Could Get Back To $200 In A Year

When we’re in a bear market (defined by a 20% correction from the top), it’s not unusual to see investors scrambling for value. Looking for good stocks that have been dropped into the bargain bin is at least one way to feel optimistic about the future. After all, it’s not like there’s much in the way of good news when stock prices are plunging.

Nevertheless, patient investors can often find good deals. And, if you’re willing to wait for a recovery, bear markets can be great times to pick up that stock you’ve always wanted at a heavily discounted price.

Of course, that doesn’t mean these stocks aren’t first going to drop further. But, timing the market is the hardest thing to do in investing. If you find a stock you want at a price you like, then there’s nothing wrong with buying it if you plan on holding for the long-term.

In my opinion, Apple (NASDAQ: AAPL) is one of those stocks that’s trading at a very attractive price. Even if the company’s recent product launches aren’t breaking records, it doesn’t mean the business isn’t making boatloads of cash. And, AAPL has a way of beating expectations.

What’s more, the stock is trading at a forward P/E of just 10.7x, which is extremely low. Unlike some other high-flying tech companies, AAPL isn’t at some lofty valuation solely based on future potential.

As I said before, that doesn’t mean the stock isn’t going to fall further. It’s a part of many fund holdings, so when investors sell funds during bear markets, it pulls down all the components – both good and bad. That’s why I suggest a longer-term view.

Here’s the thing…

At least a few options traders agree with me. This week, I’m seeing a lot of action in the January 2020 expiration, almost all of it bullish. Traders are buying long-term (in terms of options anyhow) options strategies that suggest AAPL has plenty of upside.

As I write this, the stock is trading at about $151, well off the highs of $233 in September. But, one trader thinks $200 could be in range over the next year.

This trader purchased the January 2020 190-200 call spread. That means the 190 strike was purchased while the 200 strike was sold. The total cost of the trade was $2.00, which means breakeven is at $192 by January 2020 expiration.

Max gain is at $200 or higher, where the trade makes $8 in profit at expiration. That’s 400% profits for those counting at home. Granted, $200 is almost $50 higher than where we are now. But, there’s over a year of time built into this trade, so plenty of opportunities for AAPL to get its groove back.

The trader purchased this spread 1,000 times, so spent in premium $200,000 on the trade. That’s also the max loss potential. Of course, max gain is $800,000 if the trade works out.

I think $2 per spread is a reasonable price to pay for over a year of bullish exposure to AAPL stock. While the stock has a ways to go to get to profitable levels in this trade, the chance to earn 400% makes it a bet worth taking if you’re bullish on AAPL over the next year.

  [FREE REPORT] Options Income Blueprint: 3 Proven Strategies to Earn More Cash Today Discover how to grab $577 to $2,175 every 7 days even if you have a small brokerage account or little experience... And it's as simple as using these 3 proven trading strategies for earning extra cash. They’re revealed in my new ebook, Options Income Blueprint: 3 Proven Strategies to Earn Extra Cash Today. You can get it right now absolutely FREE. Click here right now for your free copy and to start pulling in up to $2,175 in extra income every week.

Source: Investors Alley