Category Archives: Options

Using Options to Trade the Spike in Advanced Micro Devices

There are generally two reasons why a stock a sudden, big move. Either the overall market is having a big up or down day (the systemic effect). Or, the company itself has some specific news item causing a large move (the idiosyncratic effect). Most stock specific news is related to earnings or product announcements, although sometimes it can be something entirely random.

Sticking with the more standard explanations, we tend to see gap moves in stocks after a surprising earnings announcement or an unexpected product announcement. Earnings surprises are generally straightforward but product surprises are a different matter. What kind of product announcement can cause a stock to gap (usually higher)?

In most cases, a surprise product announcement is one that comes entirely out of left field. We’re not talking about the next edition of an iPhone, but instead the unveiling of an entirely new product line.

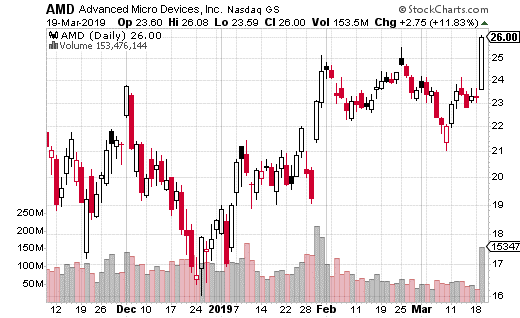
For a perfect example, look what just happened with Advanced Micro Devices (NASDAQ: AMD).

AMD is one of the biggest graphic card companies in the world (GPUs). The company’s Radeon line of graphics cards are particular prevalent in the gaming universe. The video game industry is huge and continues to grow as e-sports becomes a more mainstream phenomenon.

So, when Alphabet (NASDAQ: GOOGL) announced a new video game streaming platform called Stadia, it was huge news. What was even bigger news for AMD is that Google announced it would be using their GPUs to render the graphics for its new gaming system.

The response by investors was overwhelming positive for AMD – and why it shouldn’t it be? There’s a massive amount of potential with this service and it will clearly boost sales and profits for the company. In fact, the stock jumped 12% on the day of the announcement.

What’s more, bullish options action in AMD substantially increased. The 30-day average for bullish trades on AMD was at 60% of activity. But, the day of the announcement, bullish activity jumped to 76% of all options activity.

One strike and expiration which saw a lot of action in particular was the 27.5 strike expiring on April 5th. With the stock price around $25.50 about 2,000 of these calls were bought for about 40 cents. That’s a breakeven price of $27.90 for roughly a two-week trade.

The stock closed at $26 the day of the spike, so the trader clearly thinks the stock will keep running. The buyer is spending about $80,000 on this bullish trade, but could generate $200,000 per $1 above the breakeven price.

If you want to make a short-term bet on AMD continuing its climb, buying those short-term calls is a reasonable trade. However, you can also buy yourself more time without spending too much more in premium.

The April 18th 27 calls cost about $1 with the stock at $26. So, for a full month before expiration (and with the stock 50 cents higher and the strike 50 cents lower) you can spend $1 instead of $0.40. The breakeven point is still right around $28, but you have 2 additional weeks (and about 4 total weeks) for the trade to work.

That’s a reasonable tradeoff in my opinion and will give you a better chance to succeed if the stock keeps climbing. Given the massively bullish news, it certainly wouldn’t shock me if the stock takes a shot at $30 or above in the near future.

Using Covered Calls To Increase Your Return In Twitter

I’ve just returned from the Orlando MoneyShow and was very impressed at the amount of investors and traders looking to learn more about options strategies. I had the opportunity to deliver two different presentations to the options-oriented folks. One of the topics I spent quite a lot of time on was covered calls.

Of course, I’m a big fan of using covered calls whenever possible. But, it was nice to see that many in attendance also have tried the strategy or are interested in learnings more. I believe the more people know about the benefits of covered calls, the more popular the strategy becomes.

For instance, covered calls can often provide more steady returns from your portfolio. This consistency occurs because you are regularly receiving income from the calls you sell against the long shares you own. What’s more, the call premium can be used to offset some downside risk.

The combination of a regular income stream plus a built in hedge certainly has the effect of smoothing out the returns over time. Nobody likes inconsistent and choppy returns. It’s one of the reasons covered calls (aka buywrites) are so popular among institutions. The great things is, we can make the exact same buywrite trades as the institutions.

And don’t forget, using a covered call strategy does not preclude you from receiving a dividend. Since you are long the stock, you still get the dividend if you’re holding the shares when ex-divided comes around. Selling a call against long stock for income doesn’t impact the dividend at all – it just amplifies the yield.

Let’s take a look at a very interesting covered call I just came across in Twitter (NYSE: TWTR). TWTR is an immensely popular microblogging site which just sold off fairly sharply after earnings. The stock dropped from around $35 to $30, as you can see in the chart.

Now, TWTR isn’t a dividend paying stock, but it’s a great example of another way you can use covered calls – to earn income while you wait for stock appreciation. In this case, the covered call buyer is probably hoping for a short-term rebound in the shares.

The actual trade was buying 2,288,000 shares of TWTR versus selling the March 15th 34 call. Remember, one call needs to be sold for every 100 shares, so the call was sold 22,880 times for $0.41 per option. This was done with the stock price at $30.29.

With the covered call in place, the trader can make money all the way up to $34 in the stock price before the gains are capped due to the short call. Meanwhile, $938,000 in premium is collected regardless of what the stock does. That means the shares are protected down to $29.88 before any money is lost.

The premium collected represents a 1.4% yield for just over a month holding period. However, if the stock moves up to $34, the trader can earn another $3.71 on the trade, or an additional 12%. In dollar terms, that’s about $8.5 million of additional upside.

If you think this is a good entry point for TWTR, I believe this is a great trade to make. You are getting paid to wait for a rebound and not significantly reducing the amount of upside you can attain if the stock rallies. Plus, this trade would be very easy to roll out if the stock doesn’t rebound by March 15th.

Source: Investors Alley

Make This Trade The Smart Money’s Betting On

While stocks were likely oversold to end 2018, the action in January has been far more bullish than many expected.  It’s easy to say that there’s too much buying going on, just as many thought there was too much selling over the last three months of last year.

But, stocks have a way of moving in waves, especially when volatility is higher than normal.  We had a selling wave in December and now a buying wave in January.  Are we going to have another selling wave in February or is the rally going to continue?  Or, are we going to move sideways for a while?

Predicting market direction is never an easy task.  That’s true no matter how much experience you have, how advanced your research tools are, and how many resources you have access to.  There are simply too many variables to know for certain.

However, market volatility can be more predictable.  That doesn’t mean it’s easy to trade volatility or volatility products.  However, volatility models do tend to perform better when it comes to forecasting than directional models.

That means if I come across a big volatility trade (using ETFs or otherwise), I certainly pay attention to it.  Large volatility trades can give you a clue as to what the smart money is expecting, at least in terms of future market volatility.

Let’s take a look at a very interesting volatility trade that I recently came across in iPath Series B S&P 500 VIX Short-Term Futures ETN (NYSE: VXXB).

First off, VXXB is taking over for VXX, which expires at the end of January.  VXX is actually a note that had a 10-year life, which is about to end.  VXXB will replace VXX and will be the exact same thing. In fact, when VXX goes away, VXXB will drop the B and become the new VXX.

VXXB is the easiest way to trade volatility since it trades like a stock. It tracks the first two futures that make up the VIX calculation, so is representative of short-term volatility.

A sophisticated trader just made a ratio call spread trade in VXXB which I think is quite illuminating.  A ratio spread means the legs of the spreads aren’t all an equal amount, as you’ll see.  More specifically, with VXXB at $37.25, the trader bought the March 15th 38 call 5,000 times while selling the 43 call 10,000 times.

Because twice as many 43 calls were sold versus the 38 calls, the trade generates a credit of $0.80.  That means if VXXB is below $38 at March expiration, the trader earns $400,000.  What’s more, the trade can make additional money from $38 to $43, with max gain at $43.  In the best case scenario, the trader can make $2.5 million in appreciation plus $400,000 in credits for a total of $2.9 million.

The risk from the trade comes from the 10,000 calls sold at 43.  Only 5,000 of those are protected by the purchase at 38.  The other 5,000 are exposed to however high VXXB could realistically go.  The trade loses $500,000 per $1 in VXXB above $43.

This ratio call spread is interesting because it can be considered both bullish and bearish on market volatility. The credit aspect of the trade is moderately bearish or neutral on VXXB.  But, the long call spread feature is clearly bullish (but not too bullish).  But, the trader definitely doesn’t want to see a spike in volatility due to the unlimited loss potential on the upside.

Given the risk of the trade, the strategist making this trade clearly doesn’t believe volatility is going to spike and remained elevated prior to March expiration.  Still, this isn’t the sort of trade a casual trader should make.

Instead, stick to a straight 38-43 call spread in VXXB if you’re bullish on VXXB or want to hedge a long stock portfolio.  For those bearish on market volatility, you can use a put spread to take the opposite side for relatively cheap.

Source: Investors Alley

A Simple, Short-Term Hedge On Real Estate

Undoubtedly, most investors were hoping that the first rally of the New Year was going to stick around for more than just a few days. The jury is still out whether or not the market is going to continue its bearish trend. But, the surprising news from Apple (NASDAQ: AAPL) certainly casts a shadow over the brief glimmer of hope from investors.

In case you missed it, AAPL preannounced poor earnings based on slower than expected sales – primarily in China. The company lowered revenue guidance for the first time in 12 years and it sent a ripple through the markets. If one of the largest companies in the world is struggling, what’s that mean for everyone else?

It does seem to show that the trade/tariff war between the US and China is having real consequences on American companies. AAPL shares dropped 10% on the day after the announcement, with the S&P 500 pulling back 2.5%. Once again, that’s not the day bulls were hoping for after several up days in a row.

Given all the uncertainty in the market these days, it’s important for investors to understand the value of hedging. That is, every investor who owns stocks should know how to protect against downside risk. This includes those holding single stocks, ETFs, index funds, and other mutual funds.

Essentially, downside risk can be hedged with any asset that makes money as the market goes down. It’s a way to counter the losses you may incur from your long stock/fund positions. The easiest way to do this is with inverse ETFs and options.

Both inverse ETFs and options (long puts) are easy enough to implement as hedges. I’m going to focus on options in this article.

In most cases, simply buying a put option on the asset you want protected is all you need to do. A put option will only cost a fraction of the cost of the stock, so even if you lose money on the put (which is preferable) you won’t sacrifice your upside return all that much (in most cases). And since options use leverage, if your put pays off, it can cover most or all of your losses on the asset on a down move.

It’s easier to look at a hedge through an example. So here’s an actual hedge trade against real-estate stocks that recently hit the tape. By the way, that’s the beauty of an options hedge. You can pick the time frame you want, while protecting against any sort of asset class – as long as it has an ETF available (which is pretty much all of them).

The trade I’m referring to occurred in iShares US Real Estate ETF (NYSE: IYR). With IYR at $74, the trader purchased the January 11th 71.5 put for $0.32. This is essentially a one-week hedge that protects against the real estate ETF falling below $71 (technically $71.18 is the breakeven point).

The trader bought about 7,000 of these puts for roughly $220,000 in premium, which is also the max loss on the trade. However, if the market sells off sharply over the next week and takes real estate stocks down with it, the hedge will really pay off.

As a matter of fact, for every $1 below the breakeven point, the hedge will generate about $700,000. If you’re concerned about a short-term drop in real estate stock prices, this is a really good method of protecting your portfolio. Paying just $0.32 per option is a reasonable price to pay for downside protection for a week, especially given how volatile the market has been the last several months.

Apple (AAPL) Could Get Back To $200 In A Year

When we’re in a bear market (defined by a 20% correction from the top), it’s not unusual to see investors scrambling for value. Looking for good stocks that have been dropped into the bargain bin is at least one way to feel optimistic about the future. After all, it’s not like there’s much in the way of good news when stock prices are plunging.

Nevertheless, patient investors can often find good deals. And, if you’re willing to wait for a recovery, bear markets can be great times to pick up that stock you’ve always wanted at a heavily discounted price.

Of course, that doesn’t mean these stocks aren’t first going to drop further. But, timing the market is the hardest thing to do in investing. If you find a stock you want at a price you like, then there’s nothing wrong with buying it if you plan on holding for the long-term.

In my opinion, Apple (NASDAQ: AAPL) is one of those stocks that’s trading at a very attractive price. Even if the company’s recent product launches aren’t breaking records, it doesn’t mean the business isn’t making boatloads of cash. And, AAPL has a way of beating expectations.

What’s more, the stock is trading at a forward P/E of just 10.7x, which is extremely low. Unlike some other high-flying tech companies, AAPL isn’t at some lofty valuation solely based on future potential.

As I said before, that doesn’t mean the stock isn’t going to fall further. It’s a part of many fund holdings, so when investors sell funds during bear markets, it pulls down all the components – both good and bad. That’s why I suggest a longer-term view.

Here’s the thing…

At least a few options traders agree with me. This week, I’m seeing a lot of action in the January 2020 expiration, almost all of it bullish. Traders are buying long-term (in terms of options anyhow) options strategies that suggest AAPL has plenty of upside.

As I write this, the stock is trading at about $151, well off the highs of $233 in September. But, one trader thinks $200 could be in range over the next year.

This trader purchased the January 2020 190-200 call spread. That means the 190 strike was purchased while the 200 strike was sold. The total cost of the trade was $2.00, which means breakeven is at $192 by January 2020 expiration.

Max gain is at $200 or higher, where the trade makes $8 in profit at expiration. That’s 400% profits for those counting at home. Granted, $200 is almost $50 higher than where we are now. But, there’s over a year of time built into this trade, so plenty of opportunities for AAPL to get its groove back.

The trader purchased this spread 1,000 times, so spent in premium $200,000 on the trade. That’s also the max loss potential. Of course, max gain is $800,000 if the trade works out.

I think $2 per spread is a reasonable price to pay for over a year of bullish exposure to AAPL stock. While the stock has a ways to go to get to profitable levels in this trade, the chance to earn 400% makes it a bet worth taking if you’re bullish on AAPL over the next year.

  [FREE REPORT] Options Income Blueprint: 3 Proven Strategies to Earn More Cash Today Discover how to grab $577 to $2,175 every 7 days even if you have a small brokerage account or little experience... And it's as simple as using these 3 proven trading strategies for earning extra cash. They’re revealed in my new ebook, Options Income Blueprint: 3 Proven Strategies to Earn Extra Cash Today. You can get it right now absolutely FREE. Click here right now for your free copy and to start pulling in up to $2,175 in extra income every week.

Source: Investors Alley

How To Protect Yourself Against the Next Market Crash

The New Year is rapidly approaching, but instead of a Santa Claus Rally we’re mostly just seeing further declines in stock prices. The S&P 500 is already down about 6% in December alone – and has dropped nearly 3% for the year. That’s hardly the year most were expecting 2018 to be.

Unfortunately for stock buyers, there isn’t an obvious all-clear signal on the horizon. We could have several more weeks or even months of high volatility ahead. In fact, the current situation resembles a bear market, despite the economy still being fairly robust at the moment.

Undoubtedly, there are concerns over global economic growth slowing down. And of course, the financial markets tend to be forward looking. Still, there doesn’t appear to be a recession right around the corner. In fact, recent U.S. consumer spending data was better than expected.

So why then do stocks continue to sell off?

First off, investors are concerned over the trade war with China and the impact that tariffs may have on corporate earnings. We’ve already seen how negative trade wars news has taken a toll on major companies like Apple (NASDAQ: AAPL), which has dropped 14% over the past month.

But even more concerning may be interest rates. The Fed may be forced to raise rates to stave off inflation (because the U.S. is at full employment). However, both the government and many individuals are saddled with a boatload of debt.

That means raising rates will increase interest payments across the board. That doesn’t even include the impact of higher rates on the housing market and business loans. It’s no wonder the investment community has been laser focused on anything the Fed says and does.

So is the solution to simply go to cash until the storm clears? Generally speaking, I’m not a fan of going to cash when it’s fairly easy to hedge your portfolio risk with options. Moreover, options allow you to find tune your hedging to best match your portfolio. Or, you can simply hedge the market itself.

One trade strategy I like in this environment is buying a put spread in iShares Russell 2000 ETF (NYSE: IWM). IWM is the most popular ETF for trading US small cap stocks. I like using it to hedge because it isn’t as expensive (in absolute terms) as a the more broad-market focused SPDR S&P 500 ETF (NYSE: SPY). And, small caps tend get hit first and hit harder than blue chip and other large cap stocks.

Some traders prefer to buy naked puts for hedging purposes as they don’t want their gains to be capped in an all-out meltdown. However, I prefer put spreads as I want to keep my hedges as economical as possible even during scarier periods like we’re in currently.

To that end, with IWM trading at about $140, you can buy the February 15th 130-135 put spread for right around $1.25. That means you’d buy the 135 put while simultaneously selling the 130 put for a total premium outlay of $125 per spread.

Your max risk is simply the $125 spent per spread, while max gain is $375 if IWM is below $130 at expiration. That represents a 300% gain. Breakeven for the trade is at $133.75, or about 4.5% lower.

In other words, your hedge doesn’t start working until the index drops 4.5% or lower. However, if there’s a sustained selloff (say 10% down) you’ll make 300% on your hedge. For about 2 months of protection and $125 per spread, I think it’s a very reasonable way to hedge downside risk in a stock portfolio.  [FREE REPORT] Options Income Blueprint: 3 Proven Strategies to Earn More Cash Today Discover how to grab $577 to $2,175 every 7 days even if you have a small brokerage account or little experience... And it's as simple as using these 3 proven trading strategies for earning extra cash. They’re revealed in my new ebook, Options Income Blueprint: 3 Proven Strategies to Earn Extra Cash Today. You can get it right now absolutely FREE. Click here right now for your free copy and to start pulling in up to $2,175 in extra income every week.

Easy Way To Make 133% Profits From Higher Interest Rates

Despite all the headlines about the upcoming trade summit with China, it’s interest rate expectations that are more likely driving the financial markets. Yes, a trade war with China is bad for both countries (and the global economy) and a resolution would certainly be good news for stocks.

However, from a global perspective, interest rate levels are far more impactful on the markets. What happens with interest rates, or more precisely, with interest rate expectations, has a rippling effect across multiple asset classes.

Changing interest rates affect housing prices, commodity prices, companies with a lot of debt, companies looking to borrow, consumer spending, and everything in between. So, when Fed Chair Powell seemed to back off on another interest rate hike in December, it’s not a huge surprise that stocks rocketed higher.

On the other hand, rather than go down (or do nothing), long-term interest rates actually appeared to go a bit higher. The iShares 20+ Year Treasury Bond ETF (NASDAQ: TLT) is a very common way to track long rates and is probably the most heavily traded ETF related to interest rates.  TLT tracks bond prices which move inversely to interest rates.

You can see from the chart that TLT dropped after Powell made his dovish statement on interest rates. While the ETF definitely recovered from its lows, it certainly did not move higher – which many investors may have expected with the Fed potentially pausing its rate increase timeline.

So what does it mean?

First off, bond prices are very forward looking, and the Fed pausing a rate hike is probably a temporary situation. It’s not likely at this point that rates are going to go back down. That could change at some point, but clearly bond traders don’t believe now is that time.

What’s more, the Fed generally operates at the front-end of the Treasury yield curve. That is, it pulls levers which impact short-term rates. TLT is based on long-term rates. While short-term rates clearly have a direct effect on long-term rates, they don’t always have to move in unison. The shape of the yield curve can change as well (long and short rates moving at different times, to different extents).

As always, for further guidance, I like to see what the options market is saying. Here’s a trade that caught my interest…

A well-capitalized trader purchased 10,000 of the TLT December 21st 113-114 put spreads for $0.43 with TLT trading at $114.70. That means the trader bought the 114 puts and simultaneously sold the 113 puts. The total dollar cost of the trade is $430,000, which is also the max loss if TLT remains above $114 on December expiration.

However, if TLT drops to $113 or below, the trader makes $570,000, or 133% gains. Keep in mind, TLT only needs to drop $1.70 over the next 3 weeks for max gain to be reached. That’s only a 1.5% move in the ETF.

Basically, the trader is betting on (or hedging against) a small drop in bond prices (or a slightly higher move in long-term interest rates) by the end of the year. You many not think that a $1 wide put spread is going to be very lucrative, but as you can see, it only takes a small move in TLT for the trade to generate 133% in profits.

If you think rates are going higher or want to protect against the scenario, this trade is a cheap, easy way to do so.

   [FREE REPORT] Options Income Blueprint: 3 Proven Strategies to Earn More Cash Today Discover how to grab $577 to $2,175 every 7 days even if you have a small brokerage account or little experience... And it's as simple as using these 3 proven trading strategies for earning extra cash. They’re revealed in my new ebook, Options Income Blueprint: 3 Proven Strategies to Earn Extra Cash Today. You can get it right now absolutely FREE. Click here right now for your free copy and to start pulling in up to $2,175 in extra income every week.

A Quick Way to Hedge Your Portfolio Into The New Year

Despite the volatility and heavy stock selling in October, many analysts are expecting the remainder of 2018 to be bullish. The S&P 500 was only up 3% year-to-date after the October bloodbath (prior to mid-term elections), so it stands to reason that stocks are more likely to go up in the final two months of the year than continue to plummet.

Of course, stocks don’t move in a vacuum. There are key factors which could heavily impact the direction of the stock market over the next several weeks. While the impact of the mid-term elections is the most talked about variable, ultimately, interest rate policy may be the more important.

That’s not to say politics don’t matter – they do to some extent. Tax policy matters for certain, although there isn’t likely going to be much change on that front until the next presidential election. Tariffs matter and we’ve seen what impact they can have on quarterly earnings. This week’s election could possibly have an impact on tariff policy, although there’s nothing definitive in that regard.

On the other hand, what the Fed says at this week’s FOMC meeting could have a more meaningful effect on the market. Most importantly, if there’s a definitive statement on interest rate increases or lack thereof, we could see a major shift of funds between asset classes. In other words, stocks could move quite a bit either way if the Fed says anything unexpected.

Getting back to my original statement, it does seem like most analysts are leaning bullish for stocks once this week is in the rearview mirror. It could simply be a matter of having a significant amount of uncertainty resolved, regardless of the results.

I tend to agree that the markets should see a significant downturn in volatility for the rest of the year, pretty much no matter what happens with the Fed and elections. What happens with stocks is a bit more of a toss-up.

In the options market, I’ve seen quite a bit of action betting on a downturn in volatility – which typically coincides with stocks going up. On the other hand, I did come across a pretty large trade which looks like it could be using a bet on higher volatility as a hedge against an additional downturn in stocks.

The trade took place in iPath S&P 500 VIX Short-Term Futures ETN (NYSE: VXX), which is by far the most popular exchange traded product for trading market volatility. As a reminder, VXX tracks short-term volatility by trading just the first two futures month of the VIX futures curve.

A strategist placed a large, three-part bullish trade on VXX. Roughly 14,000 January 2019 37-47 call spreads were purchased (buying the 37 strike, selling the 47 strike). At the same time, the call spread was financed by selling January 30 puts (also about 14,000 times). The trade was structured in a way that the trader only had to pay about $0.10 per spread in total.

Basically, anything from $37 to $47 in VXX in January makes money (with the max coming at $47). Any price below $30 at that point loses money. And, anything between $30 and $37 is roughly breakeven. It’s a little risky because of that $30 floor – but volatility also isn’t likely to plunge far below $30 given everything going on in the US right now.

I believe this is simply a cheap hedge against a further selloff in stocks. The short 30 put makes it a bit risky, and not the sort of trade casual traders should make. Still, a VXX hedge through January isn’t a bad idea just in case the markets take a turn for the worse.

In that case, I recommend a basic call spread in VXX. To lower the cost of the spread, we could do a December 21stexpiration instead of January and narrow it to a 5 point spread instead of 10. Moreover, we could use an at-the-money spread like a 35-40 call spread or 36-41 call spread (with VXX at $35).

For example, the December 21st 36-41 call spread (buying the 36 strike, selling the 41 strike) costs about $1.20. That means max loss is just the $120 per spread, breakeven is at $37.20 and max gain is at $41 for $380. Max gain would produce 317% gains, which should help offset some losses from stocks if volatility spikes at the end of the year.

  [FREE REPORT] Options Income Blueprint: 3 Proven Strategies to Earn More Cash Today Discover how to grab $577 to $2,175 every 7 days even if you have a small brokerage account or little experience... And it's as simple as using these 3 proven trading strategies for earning extra cash. They’re revealed in my new ebook, Options Income Blueprint: 3 Proven Strategies to Earn Extra Cash Today. You can get it right now absolutely FREE. Click here right now for your free copy and to start pulling in up to $2,175 in extra income every week.

Source: Investors Alley

Volatility Will Normalize and Here’s How To Profit When It Happens

Market volatility has essentially become a mainstream metric in the investment realm – especially for anyone who does any short-term trading. Most traders are now aware of what the VIX is and how a higher level in the volatility index usually means more uncertainty in the market.

While investors and traders may not be able to explain what the VIX actually is (the implied volatility of S&P 500 options), they do realize it’s important to keep an eye on market volatility. Generally speaking, higher volatility levels can precede a selloff in stocks. Conversely, a falling VIX may give us an “all clear” signal during more tumultuous times.

Options traders should be more intimately familiar with the concept of volatility. Since volatility is the key component in the calculation of options prices, it is vital for active options traders to have at a least a basic understanding of how it works.

One thing I’ve noticed while speaking at the MoneyShow and Traders Expo investment conferences is that traders appear to have a growing interest and understanding of volatility. It’s definitely an encouraging trend. The more options traders (and stock traders for that matter) understand about volatility and how it impacts the market, the better chance they have of avoiding catastrophic losses.

But here’s the thing…

Volatility doesn’t just tell you when to get out of your long positions. It can also be a great signal for when to get back in the stock market. For example, if the VIX is headed lower after a turbulent period in stocks, it could mean that investors aren’t hedging as much because the feel the uncertainty is coming to an end.

When volatility spikes, I like to look at the options action on volatility ETPs (exchange traded products) such as iPath S&P 500 VIX Short-Term Futures ETN (NYSE: VXX). VXX is a widely popular ETN used to trade short-term volatility. VXX will go down when front-month VIX futures (the VIX itself is not tradable) move down. Thus, it’s an easy way to bet on volatility going down (without having to trade futures).

What’s more, bearish options action in VXX could be a sign that traders expect volatility to come down in the near future. For instance, I recently came across a bear call spread – a call spread sold for a credit – which predicts that VXX isn’t going to keep climbing prior to mid-November.

More specifically, with VXX right around $40, a trader sold 6,500 November 16th 45-60 call spreads for $1.21 credit per spread. That means the trader sold the 45 call and bought the 60 call at the same time. The strategy reaches max profit as long as VXX is under $45 by expiration.

If VXX stays below $45, the trader could pocket $786,000 dollars. However above $46.21 (the breakeven point) the call spread seller could lose $650,000 per dollar higher – all the way to $60. In other words, this could be a very risky strategy.

The strategist who placed this trade clearly believes VXX isn’t going much higher in the next two weeks and more likely, is headed lower. Keep in mind, once mid-term elections and the FOMC meeting are over with in the first full week of November, there may not be much action heading into the Thanksgiving holiday. That is to say, I think this trade makes a lot of sense.

Nevertheless, selling potentially risky call spreads is not a strategy I recommend for most options traders. In fact, I believe it’s far easier to simply buy a put spread on VXX instead.

If you think volatility is going to drop after the mid-term elections/FOMC meeting, buying the 37-34 put spread (buying the 37 put, selling the 34 put) can be done for about $1.20 with VXX at $39. That’s a reasonable price to pay given how quickly volatility can move (up or down). Moreover, the trade can max out at 150% gains if VXX drops to $34 or below by expiration.


Is It Time To Sell Volatility Again?

One of the most popular trading strategies of the last couple years is the short volatility trade – up until February of this year, the strategy could almost do no wrong. With dividends and fixed income not producing enough yield for many income investors, short volatility was used to fill the void.

And it worked like a charm. For pretty much all of 2016 and 2017, if you sold market volatility (generally accomplished by using volatility ETPs), you made money consistently. It wasn’t until the volatility spike in February, and the subsequent volatility ETP implosion, that many casual traders realized the dangers of shorting volatility.

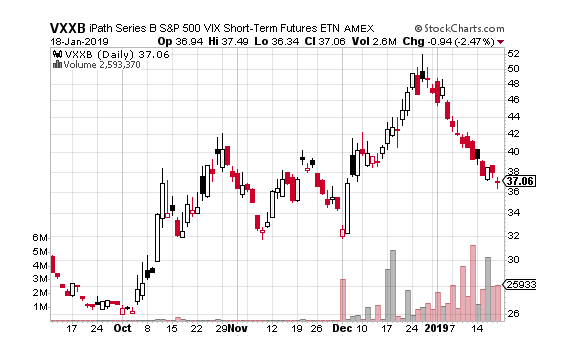
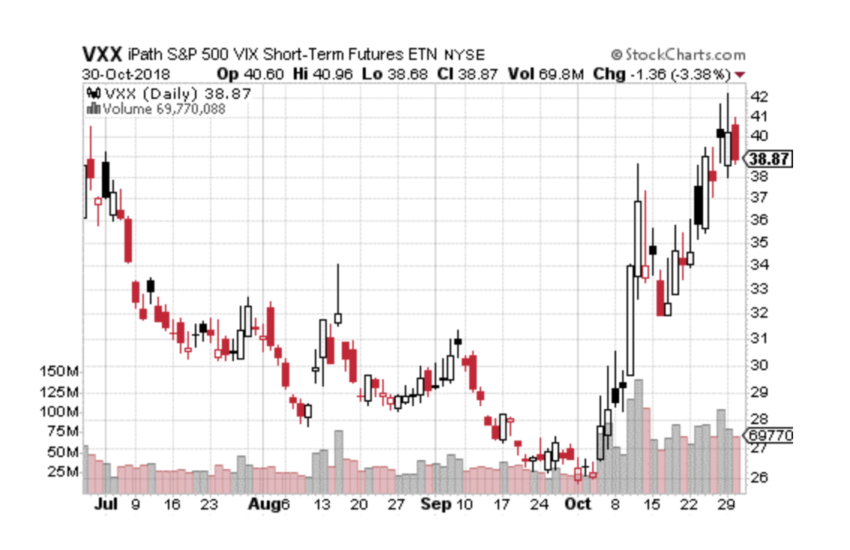
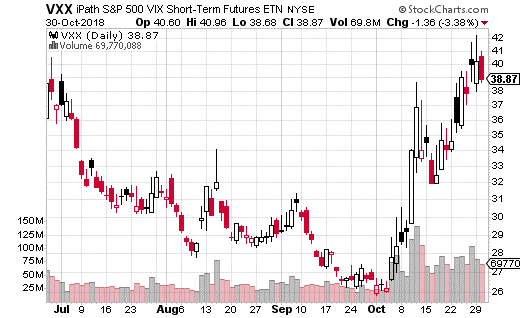
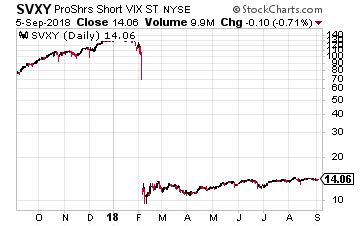
That’s not to say selling volatility is a bad idea. Quite the contrary, intelligently shorting of volatility (adhering to a strict risk management plan for one) can be a great way to generate income. Even after the death of XIV (a short volatility ETP) and the declawing of Proshares Short VIX Short-Term Futures ETF (NYSE: SVXY), going from -1 inverse short-term VIX to -0.5 inverse, shorting volatility has persisted.

Yet, there’s certainly less of a market for short volatility strategies than there once was. No doubt, many casual volatility sellers were hurt by the February volatility event. And perhaps more importantly, realized volatility has been higher for much of this year.

Let’s face it, there’s a reason why volatility selling was so profitable for so long… there was nothing going on. These days, well, there’s definitely a lot more to worry about on the macro level. We have potential trade wars and tariffs, a US administration that’s a wild card, and renewed debt concerns in Europe. In other words, there are reasons for higher volatility, and savvy traders are not going to blast out volatility against a rising tide.

On the other hand, when volatility is higher than normal, it’s often the best time to sell. Most spikes in volatility don’t signal an impending stock correction. And, we are in the midst of strong economic growth. Chances are, a short volatility strategy will pay off in the near-term.

So how do you decide when to sell volatility? There are plenty of metrics to look at beyond the VIX price itself. You could delve into the VIX term-structure or look at the put/call ratio in key market indices. You could also see what big trades have happened in volatility products and what they may portend.

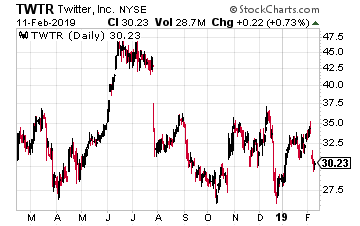
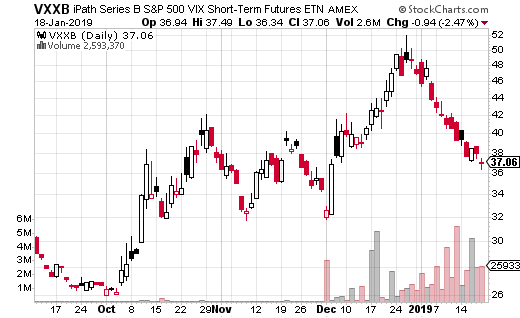
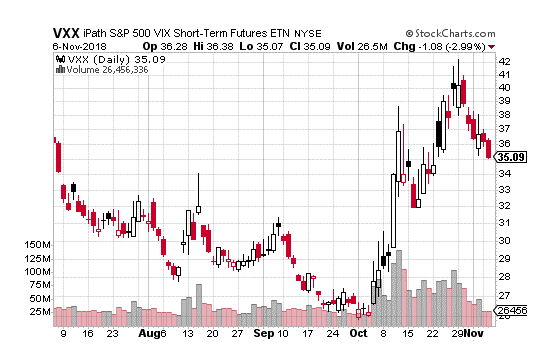
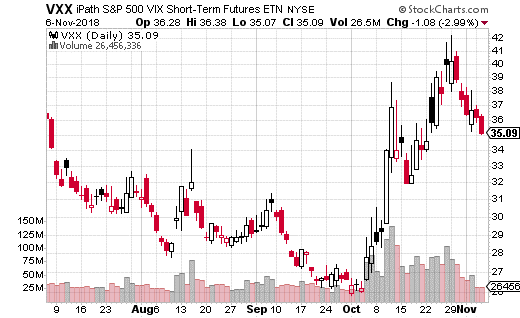
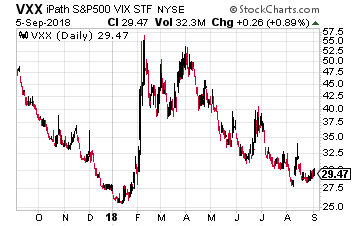
For instance, a huge block trade that caught my eye this week was a trader selling nearly 13,000 of the iPath S&P 500 VIX Short-Term Futures ETN (NYSE: VXX) 47 calls expiring on October 5th with the stock at $29.61. The trader collected $0.58 per contract or around $740,000 for the trade.

As you can see from the chart below, VXX doesn’t look like $47 is within reach over the next month (breakeven for the trade is actually $47.58). However, don’t forget that when volatility spikes, VXX can move huge percentages in a day. While this trade is highly likely to be a winner, the call seller is also open to unlimited upside risk.

Of course, we don’t know what this trader is doing behind the scenes. The risk may be hedged in other ways. But as a general rule of thumb, it’s a bad idea to sell uncovered calls like this. It’s imperative that you have your upside risk under control, especially when selling volatility.

If you do think selling volatility is in order over the next month, then I’d recommend simply buying puts or put spreads. In that way, you have defined risk, with a chance to still make decent profits if no volatility event materializes prior to expiration. The October 5th 27-29 put spread (buying the 29 put, selling the 27 put) only costs about $1 (with VXX around $29.70) for 30 days of control. At that price, making around 100% profit is an achievable goal and your max loss is just the premium paid.  [FREE REPORT] Options Income Blueprint: 3 Proven Strategies to Earn More Cash Today Discover how to grab $577 to $2,175 every 7 days even if you have a small brokerage account or little experience... And it's as simple as using these 3 proven trading strategies for earning extra cash. They’re revealed in my new ebook, Options Income Blueprint: 3 Proven Strategies to Earn Extra Cash Today. You can get it right now absolutely FREE. Click here right now for your free copy and to start pulling in up to $2,175 in extra income every week.