While stocks were likely oversold to end 2018, the action in January has been far more bullish than many expected. It’s easy to say that there’s too much buying going on, just as many thought there was too much selling over the last three months of last year.
But, stocks have a way of moving in waves, especially when volatility is higher than normal. We had a selling wave in December and now a buying wave in January. Are we going to have another selling wave in February or is the rally going to continue? Or, are we going to move sideways for a while?
Predicting market direction is never an easy task. That’s true no matter how much experience you have, how advanced your research tools are, and how many resources you have access to. There are simply too many variables to know for certain.
However, market volatility can be more predictable. That doesn’t mean it’s easy to trade volatility or volatility products. However, volatility models do tend to perform better when it comes to forecasting than directional models.
That means if I come across a big volatility trade (using ETFs or otherwise), I certainly pay attention to it. Large volatility trades can give you a clue as to what the smart money is expecting, at least in terms of future market volatility.
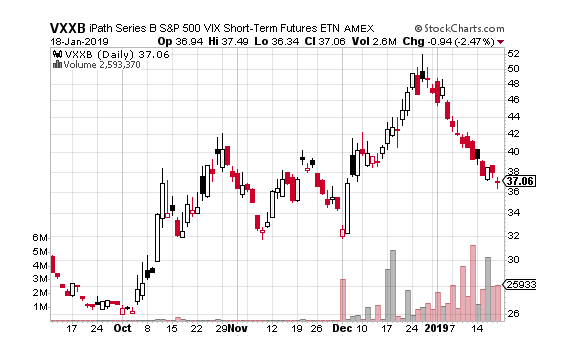
Let’s take a look at a very interesting volatility trade that I recently came across in iPath Series B S&P 500 VIX Short-Term Futures ETN (NYSE: VXXB).
First off, VXXB is taking over for VXX, which expires at the end of January. VXX is actually a note that had a 10-year life, which is about to end. VXXB will replace VXX and will be the exact same thing. In fact, when VXX goes away, VXXB will drop the B and become the new VXX.
VXXB is the easiest way to trade volatility since it trades like a stock. It tracks the first two futures that make up the VIX calculation, so is representative of short-term volatility.
A sophisticated trader just made a ratio call spread trade in VXXB which I think is quite illuminating. A ratio spread means the legs of the spreads aren’t all an equal amount, as you’ll see. More specifically, with VXXB at $37.25, the trader bought the March 15th 38 call 5,000 times while selling the 43 call 10,000 times.
Because twice as many 43 calls were sold versus the 38 calls, the trade generates a credit of $0.80. That means if VXXB is below $38 at March expiration, the trader earns $400,000. What’s more, the trade can make additional money from $38 to $43, with max gain at $43. In the best case scenario, the trader can make $2.5 million in appreciation plus $400,000 in credits for a total of $2.9 million.
The risk from the trade comes from the 10,000 calls sold at 43. Only 5,000 of those are protected by the purchase at 38. The other 5,000 are exposed to however high VXXB could realistically go. The trade loses $500,000 per $1 in VXXB above $43.
This ratio call spread is interesting because it can be considered both bullish and bearish on market volatility. The credit aspect of the trade is moderately bearish or neutral on VXXB. But, the long call spread feature is clearly bullish (but not too bullish). But, the trader definitely doesn’t want to see a spike in volatility due to the unlimited loss potential on the upside.
Given the risk of the trade, the strategist making this trade clearly doesn’t believe volatility is going to spike and remained elevated prior to March expiration. Still, this isn’t the sort of trade a casual trader should make.
Instead, stick to a straight 38-43 call spread in VXXB if you’re bullish on VXXB or want to hedge a long stock portfolio. For those bearish on market volatility, you can use a put spread to take the opposite side for relatively cheap.
Source: Investors Alley