Dump These 3 Popular Income Funds Before They Blow Up Your Portfolio

With my focus on higher yield investments, I often receive questions about various closed-end funds. CEFs are actively managed investment pools with shares that trade on the stock exchanges.

A lot of these funds carry very attractive yields. The danger is that this is an asset class where it is hard to separate the good from the bad from the truly ugly. Here are some danger signs and CEFs that illustrate those dangers.

There are over 500 CEFs trading on the U.S. stock exchanges. A large portion of the funds own municipal bonds and pay dividends that are the pass-through vehicles for the tax-free interest paid by munis.

These funds require different investment criteria and are a topic for another day. Today the focus is on CEFs in the taxable side of the investment universe. The group includes stock funds, bond funds, and hybrid funds.

Evaluating individual closed-end funds can be frustrating. Many fund managers are not very forthcoming about what the own in the portfolios and how they implement investment strategies. Here are some clues with examples that show potential closed-end fund problems.

Share price to NAV premiums. A defining feature of closed-end funds is that once a fund is launched, the management company will not buy back shares. Shares only trade on the stock exchange. That means a CEF will have two share prices, the market price and the net asset value (NAV).

Both deep discounts and high premiums to NAV are danger signals. If you pay a premium for NAV shares, you are paying more than the portfolio assets are worth. Premiums can collapse leading to losses in your fund investments.

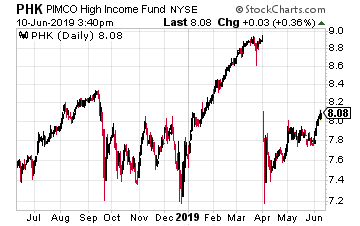
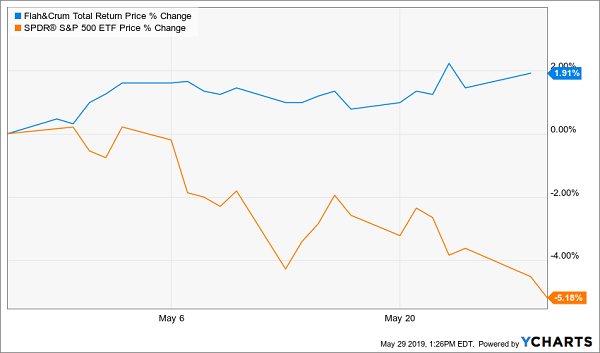
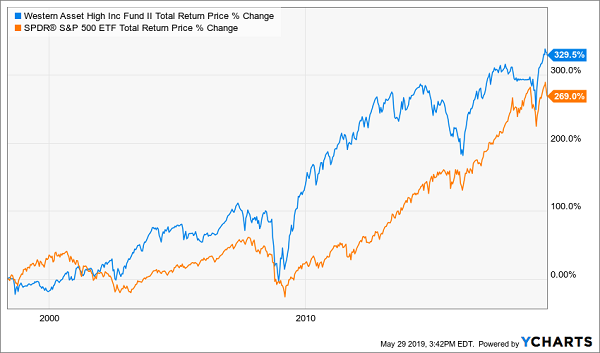
The PIMCO High Income Fund (PHK) currently trades at a 29.0% premium to NAV. This means you pay almost $1,300 for $1,000 worth of bond assets. The chart shows how the share price collapsed in in the Spring even has the NAV was stable to rising.

From the price to NAV premium alone, this is a CEF to sell, not buy. If it was on an investor’s buy list, the best course is to wait until the spread again reaches a low teens percentage, comparable to where it was at the end of 2017.

This closed-end fund is not worth the 10.6% yield.

CEF dividends are not always dividends. Closed-end funds can establish what are called managed distribution schemes. This lets a fund pay level dividends, even if the portfolio income is uneven. What are paid as dividends may be portfolio income, realized capital gains or even return of investor capital –ROC. While some ROC is not destructive to the portfolio value, it is a danger signal and may indicate the fund manager is selling assets to keep paying the dividend. That will erode the NAV over time.

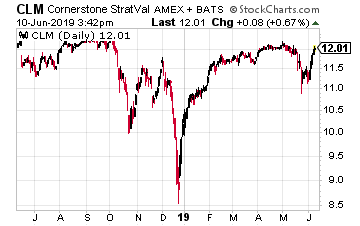
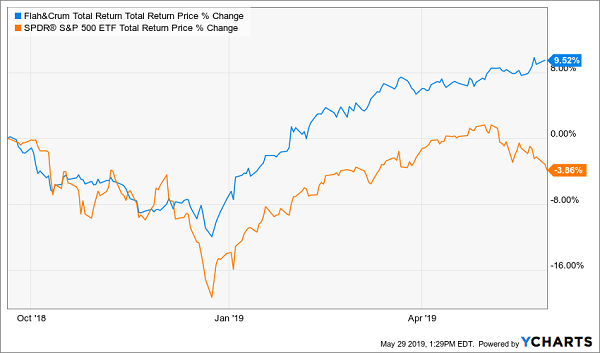
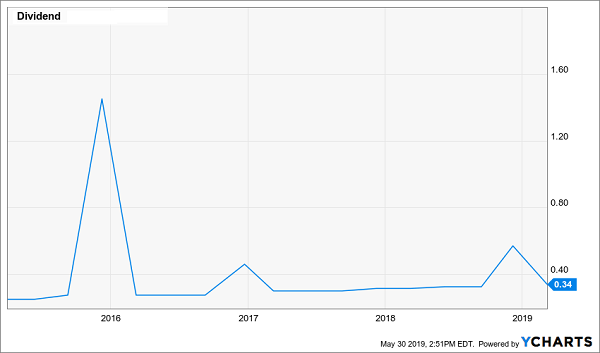
Cornerstone Strategic Value Fund (CLM) is a global equities fund with a 20% yield. CLM is paying a $0.2035 per share monthly dividend. Unfortunately, well over half of the dividend history for the last two years has been ROC.

So far in 2019, 79.7% of the dividends paid have been classified as ROC. That’s 80% of each dividend coming back as a return of the investors’ own money. The paying out of principal instead of earnings will lead to dividend cuts.

To start 2019 this fund slashed the monthly payout by 13%. This fund is an example of a CEF with an eye-popping yield that in reality provides a false sense of investment gains.

CLM is a fund to sell, not own.

Rising interest rates will be bad for bond funds. In the world of taxable CEFs, there are similar numbers of stock funds and bond funds. For bond funds, an increase in interest rates will lead to falling bond prices. The longer the maturity of bonds owned, the steeper the price decline.

Preferred shares are bond-like investments that typically do not have maturity dates. In a rising rate environment, preferred stocks share will decline even more than bond prices.

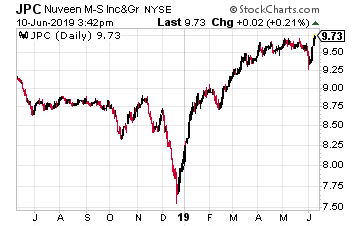
Nuveen Preferred Income Opportunities Fund (JPC) is a closed-end fund that owns a portfolio of debt securities and preferred stock.

79% of the portfolio has time to maturities more than 20 years. This is not the portfolio to own if long term rates start to increase. In additional to the long maturities, the PRF portfolio is 34% leveraged.

In a rising rate environment, the cost of leverage will go up, and that leverage will multiply the bond value drop.

This is a fund to sell if you think interest rates will go up in the next few years and is not worth the 7.5% yield.

4 Technology Stocks Blasting Higher

Remember last week, when the technology sector was slammed lower on worries over higher regulatory scrutiny? Wall Street apparently doesn’t, as stocks in the sector are zooming higher after the Nasdaq Composite dramatically tested below its 200-day moving average.

All it took was some dovish chatter from the Federal Reserve to turn sentiment around in a big way. Also helping was over-the-weekend news that President Donald Trump’s Administration had reached an agreement with Mexico, relieving the risk of fresh import tariffs.

Some impressive rallies are under way, particularly in stocks poised to benefit from the coming launch of new video game hardware in 2020. Here are four stocks worth a look:

Tech Stocks to Buy: Advanced Micro Devices (AMD)

Advanced Micro Devices (AMD)

Shares of GPU/CPU maker Advanced Micro Devices (NASDAQ:AMD) are zooming higher, pushing up and over the prior highs set last September to return to levels last seen in 2006. This comes as hype builds for the new Xbox and PlayStation game consoles from Microsoft (NASDAQ:MSFT) and Sony (NYSE:SNE) next year. Both are using AMD’s hardware to power their devices.

The company will next report result son July 24 after the close. Analysts are looking for earnings of eight cents per share on revenues of $1.5 billion. When the company last reported on April 30, earnings of six cents per share matched estimates despite a 22.8% decline in revenues.

Tech Stocks to Buy: Microsoft (MSFT)

Microsoft (MSFT)

Microsoft stock is breaking up and out of a three-month consolidation range to hit new highs as hype builds for “Project Scarlett” — the company’s new Xbox console. At the 2019 E3 show, executives showcases 60 new games for both its console and the PC including Halo Infinite. The new Xbox, capable of 8K resolution, is poised to debut in late 2020.

The company will next report results on July 18 after the close. Analysts are looking for earnings of $1.21 per share on revenues of $32.8 billion. When the company last reported on April 24, earnings of $1.14 beat estimates by 14 cents on a 14% rise in revenues.

Tech Stocks to Buy: Marvell Technology Group (MRVL)

Marvell Technology Group (MRVL)

Shares of Marvell Technology Group (NASDAQ:MRVL), maker of digital and analog components for everything from hard drives to Wi-Fi cards, are rebounding to challenge the highs set in late April. This marks nearly a double off of the lows seen in late December. This also represents another challenge of the highs seen in late 2017 and early 2018.

The company will next report results on Sept. 5 after the close. Analysts are looking for earnings of 15 cents per share on revenues of $654 million. When the company last reported on May 30, earnings of 16 cents beat estimates by two cents on a 9.5% rise in revenues.

Tech Stocks to Buy: eBay (EBAY)

eBay (EBAY)

eBay (NASDAQ:EBAY) shares are pushing up and out of a five-month consolidation range, pushing to highs not seen since early 2018 and capping a rise of nearly 50% off of its December lows. Rumors have been circulating in recent weeks that the company could soon start accepting cryptocurrencies. Investors have been focusing on improved margin profile, which drove recent earnings upside surprise.

The company will next report results on July 17 after the close. Analysts are looking for earnings of 62 cents per share on revenues of $2.7 billion. When the company last reported on April 23, earnings of 67 cents per share beat results by four cents on a 2.4% rise in revenues.

As of this writing, William Roth did not hold a position in any of the aforementioned securities.

Source: Investor Place

Weekly Market Summary: New Month Brings New Investor Sentiment

U.S. investors appeared more than happy to turn the calendar to June this week. After the Nasdaq Composite reached correction territory on Monday, the broader stock market averages rebounded more than 2% across the board on Tuesday.

Even with 5% tariff on Mexican imports set to go in effect on June 10, the initial recovery sparked a multi-day rally. The rebound was ignited by the realization that the FOMC would be more likely to step in and lower interest rates, to better reflect market pricing in the Treasury yield curve.

The May jobs report on Friday was another case where “bad news is good for stocks”. The U.S. added just 75,000 non-farm payrolls last month, which was less than half of expectations. In addition, the readings from the previous two months were revised lower by another 75,000 jobs.

However, those data just added one more feather to the cap of folks seeking interest rate cuts. As a result, Fed funds futures are currently pricing in a 76% possibility of an interest rate cut by July, compared with a 17% chance a month ago.

Sentiment readings are also improving. The Chartcraft Investors Intelligence bullish sentiment reading fell to 42.7% this week. That’s the biggest drop in the contrarian reading since January—another good time to have bought stocks—and close to the strong buy signal of 40%.

Stocks in Play

One clear beneficiary of lower interest rates is real estate investment trusts (REIT). The group was in focus this week, as the NAREIT conference and NYU Real Estate Symposium both convened in New York, which is the equivalent of the annual Super Bowl for the sector.

Elsewhere, Campbell Soup (CPB) gained 10% a day after posting solid quarterly results. In addition, Cypress Semiconductor (CY) moved 23% higher in a day, on news that Germany-based Infineon will acquire the chip-maker.

The Week Ahead

Looking ahead to next week, Broadcom (AVGO) headlines a light earnings calendar. On the economic front, we’ll get several key readings on inflation next week. There will be a report on producer prices Tuesday, followed by consumer prices Wednesday and import/export prices on Thursday.

This week reiterated the fact that market conditions can change on a dime. Six months ago, the FOMC raised interest rates and investors were expecting another two or three rate increases for 2019.

Fast forward to today and investors are now pricing in a 58% chance that we see three interest rate cuts by the end of the year.


Source: CME Group

In the same vein, all the talk at the REIT Super Bowl a year ago was how companies were preparing for the first cycle of rising interest rates in a decade. Now, several of these same companies have been wrong-footed and may have to cut dividends in the future, even if lower rates make the safer dividends in the group appear relatively more attractive.

When sentiment changes this quickly, timing the market is a difficult task, no matter how much investment experience you have.

Fortunately, there’s a better way:

My colleague Brett Owens has devised a strategy that removes the worry of trying to time the market, amongst a sea of volatility. Better yet, he’s composed a portfolio that generates an 8% annual yield, paying steady dividends each and every month!

8% is an impressive clip, given the current yield curve where U.S. Treasury notes will lock you in at 2.1% for the next 10 years. For every $500,000 you’ve saved up, Brett’s 8% Monthly Payer Portfolio will generate $40,000 a year of income.

Most companies pay dividends quarterly, but this portfolio is structured for monthly payouts. That works out to $3,333 a month, every month, whether the broader stock market averages are up 10% one year or down 10% the next.

$3,333 is a nice chunk of change. It pays a lot of bills each month if you’re retired… or is a nice supplemental income, if you’re sick of having earned next-to-nothing in “safe” investments over the past decade.

Speaking of safety, these dividends are secure and will be paid each month… unlike some of the REITs that have been trying to time the yield curve the past several quarters.

You certainly don’t have to settle for just $40,000 a year of dividends either. If you have a cool million to invest, you could just as well generate $80,000 of income annually, or $6,666 each month!

Plus, a lot of the names in the portfolio have up to 10% upside potential. You can actually grow your nest egg, while these dividends are rolling in each month!

What’s In Store For Market Volatility? And How Do We Trade It?

Kids may be getting out of school, but it doesn’t seem like most traders are ready to go on vacation. In fact, it appears that many market watchers are glued to their screen. There’s undoubtedly been a lot more volatility over the past couple weeks than what we’ve gotten used to as the summer approaches.

Much of the market volatility (as commonly measured by the VIX) started in mid-May. The VIX (which measures the volatility of S&P 500 options) climbed above 20 for the first time since December 2018. It was at that point when it became clear there would be no easy solution to the trade war with China.

Because the tariff battle with China has been an issue for some time, the market may have settled down had it been the only negative headline to surface. But, not long after, sanctions against Huawei (the massive Chinese telecom company) were announced. This dealt another blow to stocks (particularly chip stocks, several of whom are big suppliers to Huawei).

But that’s not all…

Just recently, the White House announced a potential 5% tariff on Mexican goods, which sent stocks lower the following day.

There are several reasons why this could be a much bigger deal than the China tariffs. First of all, Mexico is a much bigger trade partner with the US than China. Second, the tariff is supposed to be contingent on Mexico reducing the flow of immigrants to the US – a situation where there’s not a cut and dry solution to the problem.

To top it all off, at the start of the week news broke that the US government is looking into anti-trust cases against the FANG companies. When it became known, it sent tech stocks into a nosedive for obvious reasons.

The VIX, which had settled down back to 15 since its spike in May, climbed all the way back to 20 at the start of June. It wasn’t looking pretty out there for stock investors. Fortunately (for bulls anyway) the Fed came in to save the day (once again).

Fed Chairman Powell said the Fed would be willing to lower rates to combat the negative impact of the tariffs. An accommodative monetary policy was just what the market wanted to hear – as evidenced by the 2% jump in the S&P 500 on the day Powell spoke.

Market volatility also pulled back on the dovish interest rate news. The VIX dropped from 19 to 17 in just one trading session. It certainly helped that the futures market began predicting a rate cut at the July FOMC meeting with a 60% probability of happening.

Options activity in the most heavily traded VIX ETF, the iPath S&P 500 VIX Short-term Futures ETN (VXX), also suggests a coming decrease in volatility. The Fed may have bought the market some time to relax with the interest rate news.

One interesting trade in VXX from this past week was a put ratio spread expiring the first week of July. With VXX at $29, the trader bought 1,000 26.5 puts and sold 2,000 24.5 puts. The total cost of the trade was $0.30.

The reason twice as many of the lower strike puts were sold was to substantially reduce the cost of the trade. Now, VXX only has to reach $26.20 over the next month for the trade to breakeven.

The tradeoff is the position has unlimited risk below $24.50. However, given the current market environment, a drop below that price seems unlikely at best.

If you believe the Fed will keep a lid on volatility, you can make a similar trade in VXX. Instead of doing a ratio trade and taking on the additional risk, you could do a simple the July 5th 24.5-26.5 put spread 1 x 1 (buying the 26.5 puts and selling the 24.5 puts).

That trade would cost about $0.57, putting your breakeven point at just under $26. Max gain is $1.43, which works out to be 251% gains if VXX ends up at $24.50 or below.

Buffett just went all-in on THIS new asset. Will you?
Buffett could see this new asset run 2,524% in 2018. And he's not the only one... Mark Cuban says "it's the most exciting thing I've ever seen." Mark Zuckerberg threw down $19 billion to get a piece... Bill Gates wagered $26 billion trying to control it...
What is it?
It's not gold, crypto or any mainstream investment. But these mega-billionaires have bet the farm it's about to be the most valuable asset on Earth. Wall Street and the financial media have no clue what's about to happen...And if you act fast, you could earn as much as 2,524% before the year is up.
Click here to find out what it is.

Source: Investors Alley

Is Now the Best Time to Own Qualcomm Stock?

Qualcomm (NASDAQ:QCOM) has had an incredible ride this year. Earlier in the year, QCOM stock was up 50% year-to-date, but now it’s up only 17%. While this sounds like a disaster, it is still double that of the S&P 500, the Invesco QQQ Trust(NASDAQ:QQQ) and Apple (NASDAQ:AAPL).

Is Now the Best Time to Own Qualcomm Stock? QCOM stock

Source: Shutterstock

Stocks that show relative strength in times of trouble are the ones that I like to bet on. Qualcomm is outperforming the markets despite the general sentiment and its own headline troubles. So it is like the bears are throwing the kitchen sink at it and the stock refuses to die. Imagine what it can do if the bad headlines abate.

If you’re already long Qualcomm stock, I suggest holding it. It’s also a good time to take an upside bet on it for 2019.

Fundamentally, it’s not cheap as it sells at a price-to-earnings ratio of 37, but this might be misleading here because of its potential future business with Apple. They recently reached a settlement where Apple becomes a QCOM client. While the deal is not yet set in stone because of outside factors, eventually it’s likely to happen. Even then, QCOM is not too bloated, so owning it for a trade here is not likely to be a major financial debacle.

In early May, I wrote about how investors should not panic out of QCOM because of the short-term volatility. But I also noted that “[t]he better entry points into the stock would be at pivot zones and those are at $80, $76 or $68.” We are at that opportunity now.

It had great momentum going into earnings but then dipped on the headline. Then this whirlwind of bad Wall Street sentiment took QCOM stock back to the bottom of the massive gap it left after the headline settlement with Apple. So those fast profits are now gone and this makes for stronger hands holding the stock.

Furthermore, there is a lot of premium that came out of all stocks, especially the tech industry, so there is much less overall froth in the system now than a month ago.

More importantly, yesterday we had a virtual bloodbath in the tech world where the FANG gang stocks collapsed. Stocks like Alphabet (NASDAQ:GOOG, NASDAQ:GOOGL) and Facebook (NASDAQ:FB) fell 8% on regulatory headlines. Even AAPL is now on the authority hit list.

How to Approach QCOM Stock Today

The good news for Qualcomm is that it was only down 0.25% when the Nasdaq QQQ was down 2.2%. QCOM again showed relative strength and further suggests that it has already shed most of its fat and that bulls are ready to support it at these levels.

These are still dangerous times for stocks for the short term. We are expecting new tariffs to hit Mexico in six days. The problem gets bigger when we see the other regulatory agencies also attacking the biggest and best U.S. companies. They are doing this while the U.S. is busy fighting a global economic tariff war. So clearly we have to assume that politicians have weaponized U.S. stocks to benefit their agendas.

Remember that the FANG gang has already declared war on China years ago when they pulled out of it. Instead of rewarding them, the U.S. government wants to punish them when they are most vulnerable, especially GOOG, Amazon (NASDAQ:AMZN) and Facebook (NASDAQ:FB).

This saga is still ongoing, so we cannot assume that the absolute bottom is in. But true to my statement in early May, this here is definitely a viable tactical trade.

The legislators are unpredictable, so I don’t suggest taking full-sized bets all at once. Rather, I suggest doing it in tranches and keeping my stops tight. Also there are important lines to know for the short-term risk.

If the bears can break below $64.50, they could trigger another $5 sell signal. There the support zone is even stronger. QCOM here is near a confluence of pivot zones that date back to the dot come bubble. These tend to be magnetic, but nevertheless, the recent wild and wide moves make it difficult to set a functional stop loss level, so I’d use personal risk appetites.

Conversely, the bulls can use $69.30 and $72 as rally triggers, but they will likely need the help of the overall market sentiment to improve.

Nicolas Chahine is the managing director of SellSpreads.com. As of this writing, he did not hold a position in any of the aforementioned securities. Join his live chat room free here.

  [FREE REPORT] Options Income Blueprint: 3 Proven Strategies to Earn More Cash Today Discover how to grab $577 to $2,175 every 7 days even if you have a small brokerage account or little experience... And it's as simple as using these 3 proven trading strategies for earning extra cash. They’re revealed in my new ebook, Options Income Blueprint: 3 Proven Strategies to Earn Extra Cash Today. You can get it right now absolutely FREE. Click here right now for your free copy and to start pulling in up to $2,175 in extra income every week.

Source: Investor Place

Revealed: The 4X Income Secret

I know I don’t have to tell you it’s tough (and very frustrating) trying to get any kind of income stream from your savings these days.

The average S&P 500 stock yields just 1.9%. That’s not even enough to cover inflation!

Treasuries? The 10-year note yields an almost equally pathetic 2.3%.

But there are still safe 7%+ dividends to be had—even in the “income desert” we’re living in now. I’ll show you three funds yielding up to 8.5% (more than 4 times the typical S&P 500 yield) in a second.

Dividends like those can let you clock out on a nest egg that’s far smaller than advisers say you need. I’m talking $550K—and maybe less. Here are two simple strategies for pulling it off:

  • Go contrarian: Buy safe, 7%+-paying funds when they’re out of favor (I’ll give you a simple way to determine this shortly) and hold them through any market.
  • “No Withdrawal”: We’ll build a portfolio that can let you retire on dividends alone. Because when you’re pulling in, say, a 7.5% average yield, you can generate a $40,000 income stream on just a $550K nest egg.
     
    For many folks, that’s enough to punch out, collect their dividend checks and ignore the market’s daily swings altogether!

Better yet, I’ve done the work for you.

Here are three overlooked funds yielding up to 8.5%. All three are what I call “pullback proof”: they hold the line during corrections like the “May massacre” we just saw.

High-Yield Pick No. 1: A “Preferred” 7% Dividend Paid Monthly

My first fund holds preferred shares, which are a perfect substitute for the “common” shares you probably own today.

A company’s preferred stock usually pays a much higher dividend than the “common” shares most folks buy. So by simply “trading in” your common shares for preferreds, you can double (or more) your income stream while still investing in the same company.

The tradeoff is usually less upside, but if you buy your preferreds through a well-run closed-end fund (CEF) —which I recommend—the cash return from your dividends can be so high you might not even notice.

Consider the Flaherty & Crumrine Total Return Fund (FLC) (payer of a monthly 7% dividend): it’s delivered a 214% total return (including dividends) since inception in 2003, driven by its huge cash payouts:

A Huge Gain—Mostly in Cash

And talk about pullback proof! Look at how it performed over the past month:

The Ultimate “Pullback-Proof” Play

And check out the total return FLC has posted since September 20, 2018, when last year’s collapse started.

FLC Shows Its Mettle

As you can see, the fund’s return didn’t drop nearly as far as the S&P 500 in the meltdown, and shareholders are actually up 10% since that correction started.

Finally, let’s talk upside.

With CEFs, the key number to watch is the gap between the fund’s market price and the value of the assets in its portfolio, known as the net asset value, or NAV.

As I write this, FLC’s discount stands at 4%, and it’s traded at narrower discounts (and even hefty premiums) over the last five years, so we can look forward to price gains as that discount creeps ever closer to par—and beyond.

High-Yield Play No. 2: A Top REIT Fund Yielding 7.1%

If your portfolio is low on preferreds and real estate investment trusts, you can grab both in one buy with the Cohen & Steers REIT & Preferred Income Fund (RNP).

RNP has crushed both the S&P 500 and the REIT benchmark Vanguard REIT ETF (VNQ) since inception in 2004—no mean feat for an income play like this.

A High-Yield Market Beater

And thanks to its huge dividend (current yield: 7.1%), a huge slice of that gain was in cash.

This fund taps its REIT holdings (51% of the portfolio) and preferred stocks (49%) to give us that steady 7.1% dividend (also paid monthly). And as with FLC, RNP has held up nicely this past month:

RNP Sails Through the “May Massacre” …

Also like FLC, it fell far less than the market during last fall’s correction, and bounced back faster, handing investors a nice 10% return.

… And the Fall Collapse, Too

Finally, you can grab this one at an 8.5% discount to NAV, a discount that can’t last, considering RNP’s “no-drama” approach and long history of crushing the S&P 500.

High-Yield Play No. 3: An 8.5% Dividend With Upside

The Western Asset High Income Fund II (HIX) is a high-yield bond fund with a long history of strong performance, having tripled in value (including dividends) since its IPO in the late 1990s, crushing the S&P 500.

This Fund Can’t Stop Climbing

HIX gives investors that strong return while yielding 8.5%. Management firm Legg Mason, which has been in the fixed-income business for 48 years, generates HIX’s 8.5% dividend through a portfolio that includes emerging-market bonds, high-yield corporate bonds, investment-grade corporates, bank loans and a small cash holding.

That high total return and consistent share-price performance make HIX worth your attention at any time, but now that it’s trading at a 9% discount to NAV, it’s particularly compelling.

That’s because the fund has traded near (or even above) par with its NAV for months on end in the past. So if you buy HIX now and wait for its discount to evaporate, you’d be looking at 9.9% gains on top of your 8.5% dividend stream.

5 More “Pullback-Proof” Plays Yielding Up to 9.6%

These three funds are just the start. And to tell you the truth, they’re not even my favorite “pullback-proof” buys now.

Those would be the 5 stocks in my just-released “Pullback-Proof” retirement portfolio, including one stock—a conservative lender with stellar loan performance—paying a “hidden” 9.6% dividend.

I say this stock’s dividend is hidden because its current yield—the one you’d see on Google Finance and Yahoo Finance—clocks in at 8.1%. That’s already massive, but the current yields on most screeners don’t account for one critical thing:

Special dividends.

And this REIT has a long history of special payouts. Check it out:

An 8.1% Dividend—and More

Add in this company’s last special payout, and its “real” yield pops to that incredible 9.6% I just mentioned.

Here’s what that payout means in dollars and cents: if you had $100K in this cash machine, you’d get $9,600 back in dividend cash in the past year alone—and I expect a similar total payout this year (this REIT usually rolls out its special dividend in the fall).

And when I say this stout dividend is “pullback-proof,” I mean it: check out how this stock performed in 2018—a year most investors would rather forget:

My Pick Soars in a Rough Year

That’s right: when the rest of the market tumbled, this pick’s owners actually bagged a near-14% return!

I’m ready to share the name of this pick and my 4 other top “Pullback-Proof” buys with you now.

These 5 reliable CEFs are similar to the 3 funds I showed you above, but with two critical differences: they’re set for stronger price upside (7% to 15% in the next year alone) and faster payout growth, too!

And you’re about to get the full story on each of them.

10 Highest Yield Dividend Stocks Going Ex-Div This Week

Stock SymbolEx-Div DatePay DateDiv PayoutYield
GARS06/06/1906/21/190.2313.35%
IGD06/03/1906/17/190.0611.46%
IID06/03/1906/17/190.0511.02%
FDEU06/03/1906/17/190.1210.94%
AFIN06/07/1906/17/190.0910.64%
FEI06/03/1906/17/190.110.25%
FPL06/03/1906/17/190.0710.04%
CATO06/07/1906/24/190.339.73%
FDUS06/06/1906/21/190.399.65%
WHG06/06/1907/01/190.729.37%

source: Investors Alley

Pay Your Bills for LIFE with These Dividend Stocks

Get your hands on my most comprehensive, step-by-step dividend plan yet. In just a few minutes, you will have a 36-month road map that could generate $4,804 (or more!) per month for life. It's the perfect supplement to Social Security and works even if the stock market tanks. Over 6,500 retirement investors have already followed the recommendations I've laid out.

Click here for complete details to start your plan today.