All posts by Jay Soloff

Jay Soloff is an options analyst with Investors Alley. Jay was previously the Chief Options Strategist at Hyperion Financial Group where he was the editor for over six years of several successful options newsletters. Prior to joining the online investment world, Jay was a floor trader and market maker on the CBOE, the world's largest options exchange. His experience includes trading a multi-million dollar options portfolio in equities options as well as serving as a consultant to Wall Street options trading groups. Jay also spent time as a senior analyst at a hedge fund of funds, where he analyzed professional options funds as well as traded option strategies for hedging purposes. All told, Jay has 20 years of options trading experience. He received his undergrad degree in Economics at the University of Illinois - Champaign, and his MBA and Master of Science in Information Management from Arizona State University.

How To Protect Yourself Against the Next Market Crash

The New Year is rapidly approaching, but instead of a Santa Claus Rally we’re mostly just seeing further declines in stock prices. The S&P 500 is already down about 6% in December alone – and has dropped nearly 3% for the year. That’s hardly the year most were expecting 2018 to be.

Unfortunately for stock buyers, there isn’t an obvious all-clear signal on the horizon. We could have several more weeks or even months of high volatility ahead. In fact, the current situation resembles a bear market, despite the economy still being fairly robust at the moment.

Undoubtedly, there are concerns over global economic growth slowing down. And of course, the financial markets tend to be forward looking. Still, there doesn’t appear to be a recession right around the corner. In fact, recent U.S. consumer spending data was better than expected.

So why then do stocks continue to sell off?

First off, investors are concerned over the trade war with China and the impact that tariffs may have on corporate earnings. We’ve already seen how negative trade wars news has taken a toll on major companies like Apple (NASDAQ: AAPL), which has dropped 14% over the past month.

But even more concerning may be interest rates. The Fed may be forced to raise rates to stave off inflation (because the U.S. is at full employment). However, both the government and many individuals are saddled with a boatload of debt.

That means raising rates will increase interest payments across the board. That doesn’t even include the impact of higher rates on the housing market and business loans. It’s no wonder the investment community has been laser focused on anything the Fed says and does.

So is the solution to simply go to cash until the storm clears? Generally speaking, I’m not a fan of going to cash when it’s fairly easy to hedge your portfolio risk with options. Moreover, options allow you to find tune your hedging to best match your portfolio. Or, you can simply hedge the market itself.

One trade strategy I like in this environment is buying a put spread in iShares Russell 2000 ETF (NYSE: IWM). IWM is the most popular ETF for trading US small cap stocks. I like using it to hedge because it isn’t as expensive (in absolute terms) as a the more broad-market focused SPDR S&P 500 ETF (NYSE: SPY). And, small caps tend get hit first and hit harder than blue chip and other large cap stocks.

Some traders prefer to buy naked puts for hedging purposes as they don’t want their gains to be capped in an all-out meltdown. However, I prefer put spreads as I want to keep my hedges as economical as possible even during scarier periods like we’re in currently.

To that end, with IWM trading at about $140, you can buy the February 15th 130-135 put spread for right around $1.25. That means you’d buy the 135 put while simultaneously selling the 130 put for a total premium outlay of $125 per spread.

Your max risk is simply the $125 spent per spread, while max gain is $375 if IWM is below $130 at expiration. That represents a 300% gain. Breakeven for the trade is at $133.75, or about 4.5% lower.

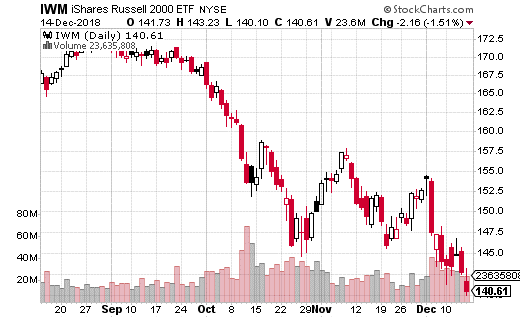
In other words, your hedge doesn’t start working until the index drops 4.5% or lower. However, if there’s a sustained selloff (say 10% down) you’ll make 300% on your hedge. For about 2 months of protection and $125 per spread, I think it’s a very reasonable way to hedge downside risk in a stock portfolio.

  [FREE REPORT] Options Income Blueprint: 3 Proven Strategies to Earn More Cash Today Discover how to grab $577 to $2,175 every 7 days even if you have a small brokerage account or little experience... And it's as simple as using these 3 proven trading strategies for earning extra cash. They’re revealed in my new ebook, Options Income Blueprint: 3 Proven Strategies to Earn Extra Cash Today. You can get it right now absolutely FREE. Click here right now for your free copy and to start pulling in up to $2,175 in extra income every week.

Earn 12% In A Month On This Twitter Covered Call

Twitter (NYSE: TWTR) is one of those companies which often poses a conundrum to investors. On one hand, the microblogging site has become an essential tool for following breaking news and insights into everything from sports to finance to politics. On the other hand, despite the popularity, the company doesn’t have an obvious path to ramp up monetization of its user base.

Regarding the issue of monetization, the company primarily makes its money on ad revenues. However, Twitter ads get mixed reviews as far as effectiveness. And frankly, the company doesn’t have many alternative for generating revenues outside of ads. Selling/licensing customer data (trends, etc.) is certainly a big growth area, but it has a ways to go to make a real impact on revenues.

On the bright side, Twitter is pretty much a must-have product for anyone who utilizes social networking. Active Twitter users include the President of the US, just about every famous athlete and entertainer, and a multitude of industry experts. For concise and/or breaking news, there’s simply no better source available.

It’s easy to see why investors are bullish on the stock. Yet, it’s equally logical to see the argument from those who may be skeptical on future growth potential. Look no further than Facebook (NASDAQ: FB) to see the potential perils of a public social media company. (Of course, TWTR has its own challenges with how it handles First Amendment issues.)

So how do you trade TWTR if you’re bullish on the stock but are concerned about downside risk?

As I matter of fact, I recently came across an interesting covered call trade in TWTR which provides a nice balance between risk and return. The beauty of covered calls is they can provide a hedge, income, and growth potential all in one trade.

This particular covered call involves selling 2,000 of the January 18th 40 call versus stock at $36.73. In other words, the trader purchased 200,000 shares of TWTR while simultaneously selling the 40 calls 2,000 times. The calls were sold for $1.10 meaning the trader collects $220,000 in premium.

First off, the $1.10 in premium collected also serves a hedge for the long stock. It protects the trader down to $35.63. Moreover, that premium represents a 3% yield on the trade, which expires in just over a month. That represent almost a 36% annualized yield.

In addition, since the trader is selling out-of-the-money calls (at the 40 strike), there is also stock appreciation potential. An additional $3.27 can be earned if the stock goes to $40 or higher by expiration. That’s represent another 9% in gains. All told, if TWTR has a good month, this trade can make as much as 12%. (In dollar terms, the trade can make about $875,000 at max gain.)

If you’re bullish on TWTR but worried about overall market conditions or company specific bad news, this is exactly the sort of trade you want to be making. You earn the 3% yield no matter what. The trade also provides a limited hedge on the stock price if the market sells off. And, you still have an additional 9% upside potential in stock appreciation.

It’s hard to argue with a relatively safe trade that can also produce 12% gains in about a month. If this trade appeals to you, I believe it’s a nice addition to any income-producing portfolio.

  [FREE REPORT] Options Income Blueprint: 3 Proven Strategies to Earn More Cash Today Discover how to grab $577 to $2,175 every 7 days even if you have a small brokerage account or little experience... And it's as simple as using these 3 proven trading strategies for earning extra cash. They’re revealed in my new ebook, Options Income Blueprint: 3 Proven Strategies to Earn Extra Cash Today. You can get it right now absolutely FREE. Click here right now for your free copy and to start pulling in up to $2,175 in extra income every week.

Source: Investors Alley

Easy Way To Make 133% Profits From Higher Interest Rates

Despite all the headlines about the upcoming trade summit with China, it’s interest rate expectations that are more likely driving the financial markets. Yes, a trade war with China is bad for both countries (and the global economy) and a resolution would certainly be good news for stocks.

However, from a global perspective, interest rate levels are far more impactful on the markets. What happens with interest rates, or more precisely, with interest rate expectations, has a rippling effect across multiple asset classes.

Changing interest rates affect housing prices, commodity prices, companies with a lot of debt, companies looking to borrow, consumer spending, and everything in between. So, when Fed Chair Powell seemed to back off on another interest rate hike in December, it’s not a huge surprise that stocks rocketed higher.

On the other hand, rather than go down (or do nothing), long-term interest rates actually appeared to go a bit higher. The iShares 20+ Year Treasury Bond ETF (NASDAQ: TLT) is a very common way to track long rates and is probably the most heavily traded ETF related to interest rates.  TLT tracks bond prices which move inversely to interest rates.

You can see from the chart that TLT dropped after Powell made his dovish statement on interest rates. While the ETF definitely recovered from its lows, it certainly did not move higher – which many investors may have expected with the Fed potentially pausing its rate increase timeline.

So what does it mean?

First off, bond prices are very forward looking, and the Fed pausing a rate hike is probably a temporary situation. It’s not likely at this point that rates are going to go back down. That could change at some point, but clearly bond traders don’t believe now is that time.

What’s more, the Fed generally operates at the front-end of the Treasury yield curve. That is, it pulls levers which impact short-term rates. TLT is based on long-term rates. While short-term rates clearly have a direct effect on long-term rates, they don’t always have to move in unison. The shape of the yield curve can change as well (long and short rates moving at different times, to different extents).

As always, for further guidance, I like to see what the options market is saying. Here’s a trade that caught my interest…

A well-capitalized trader purchased 10,000 of the TLT December 21st 113-114 put spreads for $0.43 with TLT trading at $114.70. That means the trader bought the 114 puts and simultaneously sold the 113 puts. The total dollar cost of the trade is $430,000, which is also the max loss if TLT remains above $114 on December expiration.

However, if TLT drops to $113 or below, the trader makes $570,000, or 133% gains. Keep in mind, TLT only needs to drop $1.70 over the next 3 weeks for max gain to be reached. That’s only a 1.5% move in the ETF.

Basically, the trader is betting on (or hedging against) a small drop in bond prices (or a slightly higher move in long-term interest rates) by the end of the year. You many not think that a $1 wide put spread is going to be very lucrative, but as you can see, it only takes a small move in TLT for the trade to generate 133% in profits.

If you think rates are going higher or want to protect against the scenario, this trade is a cheap, easy way to do so.


  [FREE REPORT] Options Income Blueprint: 3 Proven Strategies to Earn More Cash Today Discover how to grab $577 to $2,175 every 7 days even if you have a small brokerage account or little experience... And it's as simple as using these 3 proven trading strategies for earning extra cash. They’re revealed in my new ebook, Options Income Blueprint: 3 Proven Strategies to Earn Extra Cash Today. You can get it right now absolutely FREE. Click here right now for your free copy and to start pulling in up to $2,175 in extra income every week.

A Quick Way to Hedge Your Portfolio Into The New Year

Despite the volatility and heavy stock selling in October, many analysts are expecting the remainder of 2018 to be bullish. The S&P 500 was only up 3% year-to-date after the October bloodbath (prior to mid-term elections), so it stands to reason that stocks are more likely to go up in the final two months of the year than continue to plummet.

Of course, stocks don’t move in a vacuum. There are key factors which could heavily impact the direction of the stock market over the next several weeks. While the impact of the mid-term elections is the most talked about variable, ultimately, interest rate policy may be the more important.

That’s not to say politics don’t matter – they do to some extent. Tax policy matters for certain, although there isn’t likely going to be much change on that front until the next presidential election. Tariffs matter and we’ve seen what impact they can have on quarterly earnings. This week’s election could possibly have an impact on tariff policy, although there’s nothing definitive in that regard.

On the other hand, what the Fed says at this week’s FOMC meeting could have a more meaningful effect on the market. Most importantly, if there’s a definitive statement on interest rate increases or lack thereof, we could see a major shift of funds between asset classes. In other words, stocks could move quite a bit either way if the Fed says anything unexpected.

Getting back to my original statement, it does seem like most analysts are leaning bullish for stocks once this week is in the rearview mirror. It could simply be a matter of having a significant amount of uncertainty resolved, regardless of the results.

I tend to agree that the markets should see a significant downturn in volatility for the rest of the year, pretty much no matter what happens with the Fed and elections. What happens with stocks is a bit more of a toss-up.

In the options market, I’ve seen quite a bit of action betting on a downturn in volatility – which typically coincides with stocks going up. On the other hand, I did come across a pretty large trade which looks like it could be using a bet on higher volatility as a hedge against an additional downturn in stocks.

The trade took place in iPath S&P 500 VIX Short-Term Futures ETN (NYSE: VXX), which is by far the most popular exchange traded product for trading market volatility. As a reminder, VXX tracks short-term volatility by trading just the first two futures month of the VIX futures curve.

A strategist placed a large, three-part bullish trade on VXX. Roughly 14,000 January 2019 37-47 call spreads were purchased (buying the 37 strike, selling the 47 strike). At the same time, the call spread was financed by selling January 30 puts (also about 14,000 times). The trade was structured in a way that the trader only had to pay about $0.10 per spread in total.

Basically, anything from $37 to $47 in VXX in January makes money (with the max coming at $47). Any price below $30 at that point loses money. And, anything between $30 and $37 is roughly breakeven. It’s a little risky because of that $30 floor – but volatility also isn’t likely to plunge far below $30 given everything going on in the US right now.

I believe this is simply a cheap hedge against a further selloff in stocks. The short 30 put makes it a bit risky, and not the sort of trade casual traders should make. Still, a VXX hedge through January isn’t a bad idea just in case the markets take a turn for the worse.

In that case, I recommend a basic call spread in VXX. To lower the cost of the spread, we could do a December 21stexpiration instead of January and narrow it to a 5 point spread instead of 10. Moreover, we could use an at-the-money spread like a 35-40 call spread or 36-41 call spread (with VXX at $35).

For example, the December 21st 36-41 call spread (buying the 36 strike, selling the 41 strike) costs about $1.20. That means max loss is just the $120 per spread, breakeven is at $37.20 and max gain is at $41 for $380. Max gain would produce 317% gains, which should help offset some losses from stocks if volatility spikes at the end of the year.

  [FREE REPORT] Options Income Blueprint: 3 Proven Strategies to Earn More Cash Today Discover how to grab $577 to $2,175 every 7 days even if you have a small brokerage account or little experience... And it's as simple as using these 3 proven trading strategies for earning extra cash. They’re revealed in my new ebook, Options Income Blueprint: 3 Proven Strategies to Earn Extra Cash Today. You can get it right now absolutely FREE. Click here right now for your free copy and to start pulling in up to $2,175 in extra income every week.

Source: Investors Alley

Volatility Will Normalize and Here’s How To Profit When It Happens

Market volatility has essentially become a mainstream metric in the investment realm – especially for anyone who does any short-term trading. Most traders are now aware of what the VIX is and how a higher level in the volatility index usually means more uncertainty in the market.

While investors and traders may not be able to explain what the VIX actually is (the implied volatility of S&P 500 options), they do realize it’s important to keep an eye on market volatility. Generally speaking, higher volatility levels can precede a selloff in stocks. Conversely, a falling VIX may give us an “all clear” signal during more tumultuous times.

Options traders should be more intimately familiar with the concept of volatility. Since volatility is the key component in the calculation of options prices, it is vital for active options traders to have at a least a basic understanding of how it works.

One thing I’ve noticed while speaking at the MoneyShow and Traders Expo investment conferences is that traders appear to have a growing interest and understanding of volatility. It’s definitely an encouraging trend. The more options traders (and stock traders for that matter) understand about volatility and how it impacts the market, the better chance they have of avoiding catastrophic losses.

But here’s the thing…

Volatility doesn’t just tell you when to get out of your long positions. It can also be a great signal for when to get back in the stock market. For example, if the VIX is headed lower after a turbulent period in stocks, it could mean that investors aren’t hedging as much because the feel the uncertainty is coming to an end.

When volatility spikes, I like to look at the options action on volatility ETPs (exchange traded products) such as iPath S&P 500 VIX Short-Term Futures ETN (NYSE: VXX). VXX is a widely popular ETN used to trade short-term volatility. VXX will go down when front-month VIX futures (the VIX itself is not tradable) move down. Thus, it’s an easy way to bet on volatility going down (without having to trade futures).

What’s more, bearish options action in VXX could be a sign that traders expect volatility to come down in the near future. For instance, I recently came across a bear call spread – a call spread sold for a credit – which predicts that VXX isn’t going to keep climbing prior to mid-November.

More specifically, with VXX right around $40, a trader sold 6,500 November 16th 45-60 call spreads for $1.21 credit per spread. That means the trader sold the 45 call and bought the 60 call at the same time. The strategy reaches max profit as long as VXX is under $45 by expiration.

If VXX stays below $45, the trader could pocket $786,000 dollars. However above $46.21 (the breakeven point) the call spread seller could lose $650,000 per dollar higher – all the way to $60. In other words, this could be a very risky strategy.

The strategist who placed this trade clearly believes VXX isn’t going much higher in the next two weeks and more likely, is headed lower. Keep in mind, once mid-term elections and the FOMC meeting are over with in the first full week of November, there may not be much action heading into the Thanksgiving holiday. That is to say, I think this trade makes a lot of sense.

Nevertheless, selling potentially risky call spreads is not a strategy I recommend for most options traders. In fact, I believe it’s far easier to simply buy a put spread on VXX instead.

If you think volatility is going to drop after the mid-term elections/FOMC meeting, buying the 37-34 put spread (buying the 37 put, selling the 34 put) can be done for about $1.20 with VXX at $39. That’s a reasonable price to pay given how quickly volatility can move (up or down). Moreover, the trade can max out at 150% gains if VXX drops to $34 or below by expiration.


Is It Time To Sell Volatility Again?

One of the most popular trading strategies of the last couple years is the short volatility trade – up until February of this year, the strategy could almost do no wrong. With dividends and fixed income not producing enough yield for many income investors, short volatility was used to fill the void.

And it worked like a charm. For pretty much all of 2016 and 2017, if you sold market volatility (generally accomplished by using volatility ETPs), you made money consistently. It wasn’t until the volatility spike in February, and the subsequent volatility ETP implosion, that many casual traders realized the dangers of shorting volatility.

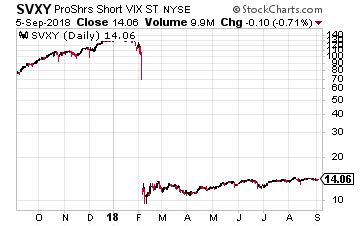
That’s not to say selling volatility is a bad idea. Quite the contrary, intelligently shorting of volatility (adhering to a strict risk management plan for one) can be a great way to generate income. Even after the death of XIV (a short volatility ETP) and the declawing of Proshares Short VIX Short-Term Futures ETF (NYSE: SVXY), going from -1 inverse short-term VIX to -0.5 inverse, shorting volatility has persisted.

Yet, there’s certainly less of a market for short volatility strategies than there once was. No doubt, many casual volatility sellers were hurt by the February volatility event. And perhaps more importantly, realized volatility has been higher for much of this year.

Let’s face it, there’s a reason why volatility selling was so profitable for so long… there was nothing going on. These days, well, there’s definitely a lot more to worry about on the macro level. We have potential trade wars and tariffs, a US administration that’s a wild card, and renewed debt concerns in Europe. In other words, there are reasons for higher volatility, and savvy traders are not going to blast out volatility against a rising tide.

On the other hand, when volatility is higher than normal, it’s often the best time to sell. Most spikes in volatility don’t signal an impending stock correction. And, we are in the midst of strong economic growth. Chances are, a short volatility strategy will pay off in the near-term.

So how do you decide when to sell volatility? There are plenty of metrics to look at beyond the VIX price itself. You could delve into the VIX term-structure or look at the put/call ratio in key market indices. You could also see what big trades have happened in volatility products and what they may portend.

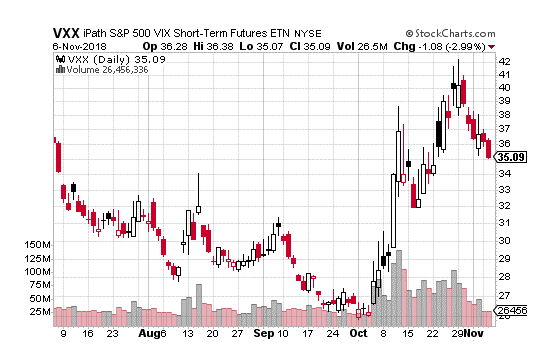
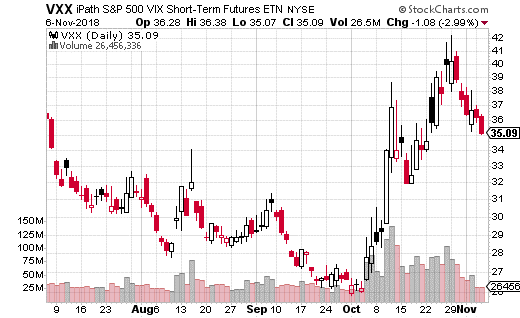
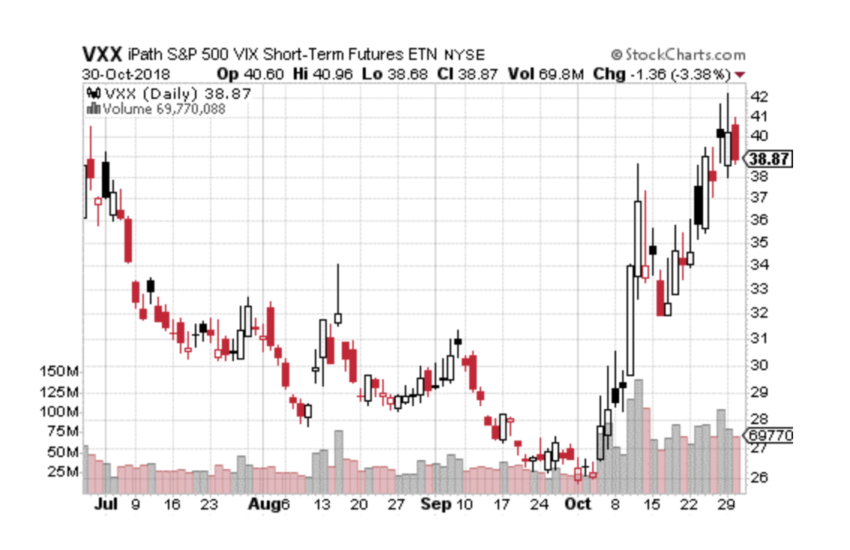
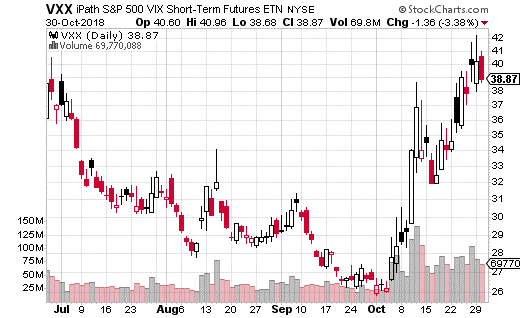
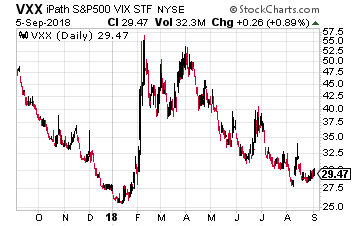
For instance, a huge block trade that caught my eye this week was a trader selling nearly 13,000 of the iPath S&P 500 VIX Short-Term Futures ETN (NYSE: VXX) 47 calls expiring on October 5th with the stock at $29.61. The trader collected $0.58 per contract or around $740,000 for the trade.

As you can see from the chart below, VXX doesn’t look like $47 is within reach over the next month (breakeven for the trade is actually $47.58). However, don’t forget that when volatility spikes, VXX can move huge percentages in a day. While this trade is highly likely to be a winner, the call seller is also open to unlimited upside risk.

Of course, we don’t know what this trader is doing behind the scenes. The risk may be hedged in other ways. But as a general rule of thumb, it’s a bad idea to sell uncovered calls like this. It’s imperative that you have your upside risk under control, especially when selling volatility.

If you do think selling volatility is in order over the next month, then I’d recommend simply buying puts or put spreads. In that way, you have defined risk, with a chance to still make decent profits if no volatility event materializes prior to expiration. The October 5th 27-29 put spread (buying the 29 put, selling the 27 put) only costs about $1 (with VXX around $29.70) for 30 days of control. At that price, making around 100% profit is an achievable goal and your max loss is just the premium paid.

  [FREE REPORT] Options Income Blueprint: 3 Proven Strategies to Earn More Cash Today Discover how to grab $577 to $2,175 every 7 days even if you have a small brokerage account or little experience... And it's as simple as using these 3 proven trading strategies for earning extra cash. They’re revealed in my new ebook, Options Income Blueprint: 3 Proven Strategies to Earn Extra Cash Today. You can get it right now absolutely FREE. Click here right now for your free copy and to start pulling in up to $2,175 in extra income every week.

Big Money Is Betting On A Big Move In Financials

I always find it fascinating to see what kind of big trades are being made in the options markets.  Some of the smartest strategists in the world use options markets as their playground, so generally speaking, you can assume a lot of research went into these blockbuster type trades.

It’s also interesting to guess what the goal of a particular block trade is.  Of course, we can never know for sure.  A trade could be a hedge or a speculative bet.  It could be part of a much larger strategy with multiple pieces in different markets and asset classes.  Unless you’re talking something like a covered call (which is self-contained), we can only make an educated guess as to what a trade’s purpose is.

Nevertheless, we can often glean important information about an asset or asset class from associated options action.   For example, when you see a large straddle being purchased, it can be a useful indicator that there’s going to be an increase in volatility or movement in the underlying instrument.

A (long) straddle is an options strategy where the trader buys a call and put at the same strike in the same expiration in an underlying asset.  By purchasing both the call and put, the trader is not reliant on the asset moving just up or just down.  The straddle allows the buyer to make money in either direction, as long as it has moved far enough from the strike.

Essentially, going long a straddle is a bet on volatility.  A buyer doesn’t have to be correct about a direction, just that the stock/ETF/etc. is going to be at a different spot than it is now.  (It’s typical for straddles to be purchased at the at-the-money price.)  Professionals will often hedge their straddle when it moves using stock.  However, there’s no reason you can’t just trade the straddle and let it ride.

Just this week, an interesting straddle hit my block trade screener which I believe is worth a second look…

A well-funded trader purchased the 28 strike January 2019 straddle (28 call plus 28 put) in the Financial Sector SPDR ETF (NYSE: XLF) for $2.51 per straddle with the stock at $27.75.  XLF is the most popular ETF for trading the financial sector.  It covers banks, insurance companies, investment companies, and a few other related industries.

This particular straddle shows that the trader likely is expecting financials to be in a very different spot in the next five months.  Of course a lot can happen in 5 months, and there’s a significant election day during that period where control of Congress will be decided.

At $2.51 per straddle, this trade will break even above $30.51 or below $25.49.  At expiration, if XLF is between those prices, the trade will lose money – although max risked is just the $2.51 spent on premium.

Still, the straddle was bought 5,000 times, which costs over $1.2 million dollars.  That’s no small amount being risked.  On the other hand, the trade will generate $500,000 in profit for every dollar above or below the breakeven points.

Besides elections, there’s also plenty of economic news and data expected in the coming months.  There will also be a handful of widely followed FOMC meetings where rate increases could occur.  In other words, there are a multitude of potential catalysts for an increase in volatility in the financial sector.

If you agree that XLF could be on the move for the remainder of the year, then this isn’t a bad way to position yourself.  $2.51 for a straddle is not an unreasonable price to pay with five months of time left until expiration.   Most importantly, you don’t have to pick a direction.

  [FREE REPORT] Options Income Blueprint: 3 Proven Strategies to Earn More Cash Today Discover how to grab $577 to $2,175 every 7 days even if you have a small brokerage account or little experience... And it's as simple as using these 3 proven trading strategies for earning extra cash. They’re revealed in my new ebook, Options Income Blueprint: 3 Proven Strategies to Earn Extra Cash Today. You can get it right now absolutely FREE. Click here right now for your free copy and to start pulling in up to $2,175 in extra income every week.

Source: Investors Alley

Making Money Off Chipmaker Stocks With Surging Prices

In the world of graphics cards, also known as GPUs, the US market is dominated by two major players. You’ve probably heard of both of these companies as their stocks are often in the news. The bigger of the two is Nvidia(NASDAQ: NVDA), but Advanced Micro Devices (NASDAQ: AMD) and their Radeon GPUs have plenty of traction in the industry.

NVDA and AMD are big players in the chip-making industry as powerful GPUs have become normal components in most desktops and many laptop computers. While potent GPUs are a perquisite for any serious video gamers, even casual games can benefit from high-end graphics cards. And let’s not forget, GPUs are the devices of choice for mining cryptocurrencies.

Even without the cryptocurrency craze, NVDA and AMD would still be doing quite well as gaming becomes a bigger part of our everyday lives. The whole e-sports industry is still relatively new and gaining popularity rapidly.

NVDA is a $150 billion company that’s seen over 30% gains this year in its share price. Meanwhile, AMD is a much smaller $18 billion company, but the stock is up 89% this year. The stock price jumped about 15% on very solid earnings just recently.

NVDA may have settled into a range, but AMD is still in breakout mode. So, how high can the stock go? Is it worth buying despite the huge year it’s already had?

To help answer these questions, I prefer to look at the options market. Here’s what I found…

A highly capitalized trader recently sold 9,000 January 2019 AMD calls at the 25 strike for $0.91 per contract (with the stock trading at $19.05). The trader is collecting over $450,000 on the calls but is exposed to unlimited upside risk above $25.91. Any price below $25 at January expiration and the entire amount of premium is kept.

So what’s going on here? $450,000 is a lot of money, but is it enough in return for unlimited risk? For every dollar the stock moves above roughly $26, the position loses $900,000. That’s obviously a heavy amount to risk, especially for a stock which has already moved up 89% this year.

The thing is, this trade is very likely being used as an overwrite on existing long AMD stock. The trader could already hold AMD shares and feels the shares won’t climb above $25 before next year. In that case, the call selling is being used to generate extra income on the long shares while still maintaining upside potential up to $25.

We could easily emulate this trade by purchasing shares and selling the same calls against them (1 call sold for every 100 shares purchased). In fact, I think that’s pretty solid covered call. You’d be earning 4.8% yield for about a 5-month period, with a chance to make an extra 31% if the stock keeps climbing.

While AMD has had a really nice run this year, it’s also probably not going to shoot above $25 anytime soon. A covered call could be a great way to capture a decent yield without giving up most of you upside potential.

If covered calls aren’t your thing, you could also make a similar trade to the short call trade by selling a call spread. The January 25-30 call credit spread (selling the 25, buying the 30) has about a $0.60 credit while limiting your risk to $4.40 if the stock skyrockets higher.

Personally, I like the covered call trade quite a bit better than the credit spread. However, the important takeaway here is don’t ever short calls by themselves. Either use stocks or other options as a hedge. Even pros rarely short calls without some kind of protection.

  [FREE REPORT] Options Income Blueprint: 3 Proven Strategies to Earn More Cash Today Discover how to grab $577 to $2,175 every 7 days even if you have a small brokerage account or little experience... And it's as simple as using these 3 proven trading strategies for earning extra cash. They’re revealed in my new ebook, Options Income Blueprint: 3 Proven Strategies to Earn Extra Cash Today. You can get it right now absolutely FREE. Click here right now for your free copy and to start pulling in up to $2,175 in extra income every week.

Source: Investors Alley 

How To Bet Big On Banking With Options

Often make the argument that trading options is superior to trading stocks. Now, I’m not talking about investing in stocks… if your goal is to collect dividends, you obviously need to buy stocks. But when it comes to trading (short to medium-term holding periods) options are almost always the better choice.

Generally, options traders will point to the built-in leverage of using options and the ease of access to underlying assets which would otherwise be difficult to afford. However, I believe the most important benefit to options is their flexibility. Most significantly, being able to tightly define your risk parameters for any given trade is a huge advantage to using options versus stocks.

Because you can you can buy and sell both calls and puts, it opens up a massive variety of options combinations (what we generally refer to as spreads). Throw in combinations of options and stocks (covered calls, delta neutral trading, etc.), and you’ve got nearly unlimited choices.

One type of spread you’ll often see professional traders use is the ratio spread, or the ratio backspread, to be more specific. This type of trade essentially has too much risk involved to be used by most casual traders. A standard backspread consists of buying an option near the money (call or put) and selling two options in the same expiration at a higher (call) or lower (put) strike.

This type of spread is very popular because it greatly reduces the cost of the trade by selling two of the farther away options. On the other hand, the double short strike means there’s unlimited risk if the underlying asset prices moves through the strike. That’s why this is a common trade among pros but generally avoided by the casual options trader.

Nevertheless, you can still glean a lot of information from large block backspreads which hit the tape. (There are also ways to roughly emulate the trade without taking on the same amount of risk.) In fact, a very interesting ratio backspread hit my screener this past week which provides a moderately bullish take on Morgan Stanley (NYSE: MS).

The spread expires in October and was put on with MS trading at $50.72. The trader purchased 15,000 of the October 52.5 calls while selling 30,000 of the 57.5 calls. Selling double of the higher strike reduced the total cost of the spread to just $0.97.

By reducing the spread cost under $1, the trader has pushed the potential return up to $4.03 or 415% gains, with breakeven at $53.47. The spread buyer also is only risking $0.97 if MS stays below the breakeven point. However, there is considerable risk above $57.5… $1.5 million for every dollar the stock moves above that point.

Keep in mind, the trader is spending almost $1.5 million to place the trade (and stands to gain over $6 million if MS closes at $57.5 on October expiration). That’s a lot of money to put down on a three-month trade. As such, there’s clearly a strong opinion – backed by capital – that MS is going higher, but not to the moon, by October.

Let’s say you like this trade, but don’t want to expose yourself to the upside risk (or margin requirement). You can simply turn the spread into a standard vertical spread and pay $1.20 instead of $0.97.  It’s a reasonably close price to the backspread detailed above without all the risk.

So why would someone want to save just $0.23 on a spread if it comes with all that additional upside risk? First off, the strategist clearly believes MS isn’t going higher than $57.5 by October. Moreover, he or she could easily hedge the position with shares (or possibly already has done so). Finally, $0.23 doesn’t seem like a lot if you’re doing a 5-lot, but when you’re doing 15,000… well, it makes a big difference ($345,000 to be exact).

  [FREE REPORT] Options Income Blueprint: 3 Proven Strategies to Earn More Cash Today Discover how to grab $577 to $2,175 every 7 days even if you have a small brokerage account or little experience... And it's as simple as using these 3 proven trading strategies for earning extra cash. They’re revealed in my new ebook, Options Income Blueprint: 3 Proven Strategies to Earn Extra Cash Today. You can get it right now absolutely FREE. Click here right now for your free copy and to start pulling in up to $2,175 in extra income every week.

How to Make A 186% Return on Video Games

Typically, when growth in the video game industry is discussed, it’s all about mobile gaming growth. After all, playing games on smartphones and tablets has been where most of the action has been in recent years, at least in terms of investing.

While casual gamers may still be driving plenty of business in mobile gaming, there’s still ample opportunity in more traditional gaming platforms, such as consoles and PCs. In fact, these traditional platforms may be even more important looking forward as AR/VR (augmented reality/virtual reality) games become more popular (and accessible).

One of the biggest players in the video game industry is Electronic Arts (NASDAQ: EA). EA is mostly known for its big label games, particular sports games and first-person shooters. Just last week, EA posted earnings and had a pretty substantial share price decline after issuing lower than expected guidance.

As you can see from the chart, EA stock dropped something like 6% the day after its earnings miss. However, the stock was having a great year up to that point and probably had become overvalued. The drop in share price may have been exactly the entry point some investors were waiting for.

First off, EA has several big games yet to come out this year which could boost revenue and earnings more than expected. I already mentioned the long-term potential of video games as AR/VR tech becomes better and cheaper. And then there’s the whole e-sports industry. Playing games competitively is an industry that’s growing like crazy and there’s a ton of money to be made in that arena, so to speak.

Here’s the thing…

A size option trader apparently agrees with me and purchased a massive call spread expiring in January of 2019. With EA stock at $132, the trader bought roughly 11,000 January 135 calls while selling the 155 calls for a total debit of $7. That means the trader spent over $8 million on the trade. Clearly, he or she if very bullish on EA over the next half year.

With $7 paid in premium, the breakeven point for the spread is at $142. That same premium is the max loss for the trade. Max gain is at a point anywhere above $155 at expiration, slightly higher than where the stock was before the earnings miss. Max gain is $13, or $14.3 million in dollar terms… that’s also a return of 186%.

I think this a decent trade to emulate. EA may not recover for a few months, but has several potential catalysts which could send the stock higher down the road. The price of the spread is not cheap, but 186% return potential and six months of time is reasonable for the cost.

If you like the trade but want to reduce your costs somewhat, you can narrow the spread. For instance, the January 135-145 call spread only costs $4 but lowers your max gain to $6. You can also pick an expiration which is closer, but I think EA may need the extra time to recover.

  [FREE REPORT] Options Income Blueprint: 3 Proven Strategies to Earn More Cash Today Discover how to grab $577 to $2,175 every 7 days even if you have a small brokerage account or little experience... And it's as simple as using these 3 proven trading strategies for earning extra cash. They’re revealed in my new ebook, Options Income Blueprint: 3 Proven Strategies to Earn Extra Cash Today. You can get it right now absolutely FREE. Click here right now for your free copy and to start pulling in up to $2,175 in extra income every week.

Source: Investors Alley