With my Dividend Hunter service, I provide a list of high-yield investments that I have deeply researched, and my analysis shows provide an attractive combination of current yield and dividend stability.
As a high-yield stock expert, I often get asked questions about other stocks or investments that are not on my recommendations list. Sometimes a question will show me a new, attractive income investment. Others are learning opportunities on what not to do when picking high-yield investments.
One investment category that generates a lot of questions is closed-end funds (CEFs).
A closed-end fund is an investment pool with shares that trade on the stock exchange. Investors are drawn to CEFs because many have double digit yields and most paid monthly dividends.
Unfortunately, with most closed-end funds there are usually more negatives than positives when evaluating one for investment potential. Here are a few of the problems you could see.
Opaque communications from management on how a CEF is managed. There are not a lot of reporting requirements and any information you find on a fund’s portfolio may be months old. I sometimes refer to the CEF universe as the swamp of managed investment products.
CEF shares can trade at a discount or premium to the net asset value (NAV). Fund sponsors do not redeem shares, so the only place to buy or sell is on the stock exchange. If you buy a fund trading at a premium, you are paying more than a dollar for a dollar’s worth of assets. Not a good deal. A CEF trading at a deep discount can be a danger sign that the management has been making some bad investments.
Dividends classified as return-of-capital (ROC) are a big danger sign. Technically, return-of-capital are dividends/distributions that are not from earned income such as dividends or interest. While there are types and circumstances where ROC is not destructive to a fund’s NAV, unless you know for sure where the ROC comes from, it’s a danger signal to a CEF’s long term viability.
To recap, the problem with many CEFs is that they are hard to analyze with several factors that on their face are dangerous to your long term investment success. With over 700 publicly traded CEF’s, it is too much work to dig a handful of good ones out of the majority of swamp muck. Here are three high yield CEF’s to dump now if you own them.
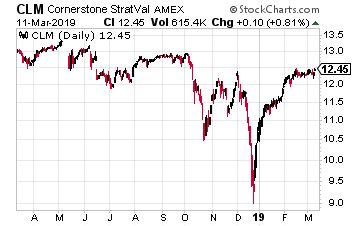
Cornerstone Strategic Value (NYSE: CLM) is a CEF with $570 million in assets that owns a portfolio of global equity (stocks) securities.
CLM currently yields over 20%. There are two big danger signals for this fund. First, it is trading at an 11% premium to NAV. The high yield has caused unwitting investors to bid up the share price to 11% above what they would be worth if the fund is liquidated.
The current monthly dividend is 20.53 cents per share. Out of that just one cent is earned income and two cents are capital gains. The remaining 19.3 cents per share is classified as ROC. Historically, most of the dividends have been ROC, which is reflected in the steadily deteriorating NAV.
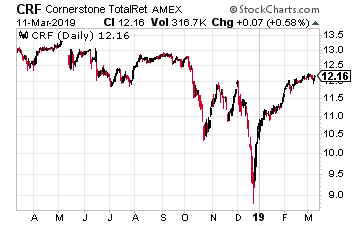
As typically happens, Cornerstone Total Return (NYSE: CRF) is a similar fund managed by the same advisory firm with the same problems.
This fund is trading at a 12.5% premium to NAV. That is very rich pricing in the CEF world.
The distributions breakdown also is like CLM. The current 19.85 cents month dividend has been paid for since the start of 2019. Each month 18.7 cents of the payout have been classified as return of capital.
Ignore the 20% yield and avoid or sell CRF.
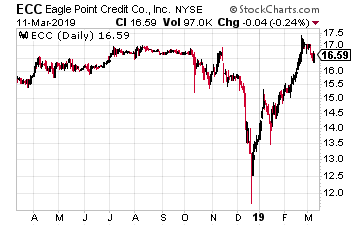
Eagle Point Credit Company LLC (NYSE: ECC)yields 14%. Due to recent large drops in the NAV, the shares trade at an eye-watering 23% premium to NAV.
Out of the 20 cents per share monthly dividends, 7 cents have recently been classified as ROC. Put another way, ECC is earning just 65% of the dividend it’s paying to shareholders.
Here’s the scariest part, the fund’s investment strategy: We seek to achieve our investment objectives by investing primarily in equity and junior debt tranches of CLOs. In plain English, they own the junkiest of the junk in the high-yield debt world.
While the Fed has for now put interest rate increases on hold, I continue to receive questions on whether REIT values will be hurt by rising interest rates. It is a widely held –but inaccurate– belief that REIT values must fall if interest rates continue to increase. The fact that many REITs increase their dividends over time tells us that these are businesses with potential for growing dividends and share values even in a rising rate environment.
Recently, I looked at the history of REIT values and interest rates. Since 1995, there has been 16 periods of significantly rising interest rates. Out of those 16, REIT values increased 12, or 75% of the time. In the period from June 2004 through August 2006 the Fed increased rates 16 times. During that period REITs outperformed the S&P 500, 59% to 22%.
The fact is that REIT results are driving more by economic conditions, rising commercial real estate values, and the ability of REITs to increase the rental rates on their properties. We can monitor how well a REIT is performing from its history of dividend growth.
Most REITs announce any dividend increases once a year, in the same month each year. Across the sector there are increase announcements in almost every month in the calendar. You can often get a nice share price gain by buying shares before a dividend increase announcement hits the news wires.
I maintain a database that covers about 140 REITs. I use the database to track dividend rates, yields and increases. Of the 140, about 90 have histories of regular dividend increases.
There are four REITs that should announce a dividend increase in April.
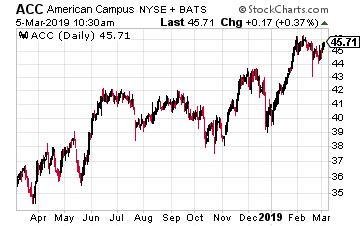
American Campus Communities, Inc. (NYSE: ACC) owns, manages and develops primarily off-campus student housing properties in the United States. The company owns over 200 properties near 96 college campuses.
While some growth comes from acquisitions or development, ACC also realizes 2.5% per year of average rental rate growth. Since resuming dividend increases in 2013, the payout has been increased by 5% to 6% for six consecutive years.
In 2018 FFO per share was in line with previous years. The current dividend is 80% of 2018 FFO per share, so another 4% to 5% increase still likely for this year to keep the growth record going.
The new dividend rate is announced at the end of April/early May with an end of May payment date.
ACC currently yields 4.1%.
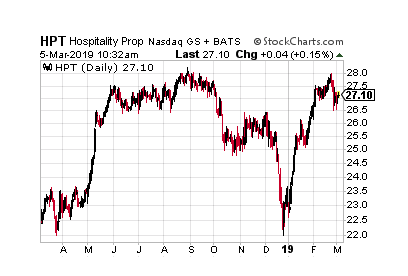
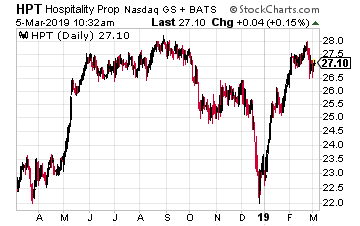
Hospitality Properties Trust (NYSE: HPT) owns 325 hotels and owns or leases 199 travel centers located throughout the United States, Canada and Puerto Rico. All the properties are leased to management operators. In 2018 FFO per share was up 2% compared to the 2017.
The current dividend rate is 57% of 2018’s FFO. For the last several years, HPT has been increasing the dividend by about 2% annually. I expect an increase this year of similar magnitude.
The new dividend rate has been announced in mid-April, with a late April record date and second half of May payment date.
HPT yields 7.9%.
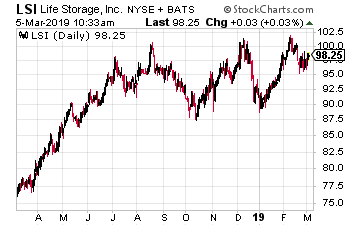
Life Storage Inc. (NYSE: LSI) owns over 750 self-storage facilities located in 28 states and Ontario, Canada. Self-storage has been a cyclical REIT sector and growth has flattened over the last year. Life Storage was growing its dividend by over 10% per year before keep the rate flat for the last two years.
For last year FFO per share increased by 3.7% so investors should look for a low single-digit dividend increase. If a boost is coming in April it will be announced near the start of the month for the dividend to be paid at the end of April.
The stock yields 4.1%.
Bonus Recommendation:
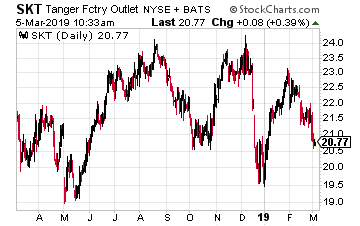
Tanger Factory Outlet Centers Inc. (NYSE: SKT)was the pioneer in developing factory outlet malls. The company has increased its dividend every year since its 1993 IPO. Over the last five years, the payout has grown at a 9/63% annual compounded rate. However, the rate was increased by just 2.2% last year.
In 2018, AFFO per share was up slightly compared to 2017 results. With the turmoil in brick and mortar retail, Tanger has stayed conservative with its balance sheet and growth projects. The current dividend just 58% of AFFO. I expect a 2% to 3% increase to keep the company’s dividend growth track record intact.
The next dividend will be announced in early April with and end of April payment date.
Earnings season for individual stocks has evolved into nothing more than a game. Analysts from the Wall Street firms put out their estimates for quarterly revenue and profits.
Those estimates are averaged into a consensus estimate. When earnings come out the stock trading world looks to see whether individual companies “beat” or “miss” the earnings estimate, which is no more than an average of computer model based guesses from analysts. It’s a silly game that unfortunately can result in sharp share price declines when a company misses analyst expectations.
For investors looking for long term wealth building and attractive dividend income, these stock price drops can, if you understand the affected companies, provide great buying opportunities. Just after earnings share price gains or drops are mostly related on where the reported results stacked up against the Wall Street estimates.
Traders currently don’t seem to be looking at comparison to past results or the prospects of the companies. This is where you, with a longer term outlook, can take advantage of the short-term, earnings “miss” price drop. If a company’s prospects are solid, a quarterly earnings miss should be viewed as an opportunity to pick up shares on sale.
Here are three stocks with earnings related price drops that have excellent long term prospects.
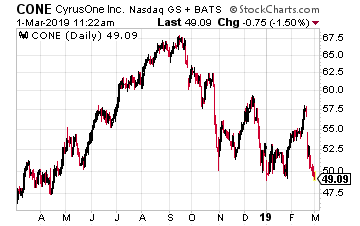
CyrusOne (Nasdaq: CONE) reported 2018 Q4 and full year earnings on February 20. Over the next week the CONE share price dropped from just over $57 to now right under $50. That’s a 12% drop in a week.
There are several reasons for the drop. The company did not follow its pattern of increasing the dividend with this earnings report. The quarterly rate declared stayed at $0.46 per share. In addition, 2019 FFO/share guidance was flat to very slightly down from the cash flow produced in 2018.
The counterpoint to the short term cash flow growth slowdown is that in 2018 the company made investments to ensure years of future growth. Land acquisitions in prime data center areas give the company capacity to construct new data centers that will triple the current footprint.
2018 revenue, EBITDA and FFO growth were 23%, 16% and 16%, respectively. The company is producing strong revenue and cash flow growth. The investment positive is that CyrusOne will have big committed investment years such as 2018 and 2019, and those investments will show up several years down the road as great returns on investment, higher FFO per share and dividend increases.
CyrusOne is in a real estate sector –data centers –that will have high demand growth for at least a decade.
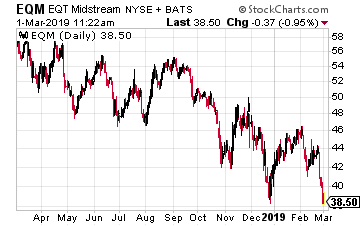
A different factor recently pushed the value of EQT Midstream Partners LP (NYSE: EQM) down by almost 10%.
The trigger event for the sell-off was a federal court refusing to hear an appeal on a ruling tossing out the construction permit of the Atlantic Coast Pipeline under construction by Dominion Energy. EQM dropped because they are the major partners on the competing Mountain Valley Pipeline –MVP. The map below shows the routes of the two pipelines.
While the two pipelines have similar routes, it’s tough to make a comparison. The biggest difference is that MVP is 70% complete, including 175 miles of the 303 miles already welded in position. In comparison, the Atlantic Coast Pipeline received construction approval in October 2018 and construction was stopped in December. MVP does need to obtain a Nationwide 12 Permit from the U.S. Army Corps of Engineers for stream and waterbody crossings.
Currently work is scaled back for the winter. Full construction work on MVP will restart in the Spring, and full in service date is forecast for Q4 2019. The EQM situation is comparable to the Atlantic Coast Pipeline legal setback.
EQM is an MLP with a current 11% yield and will grow distributions by 5% per year.
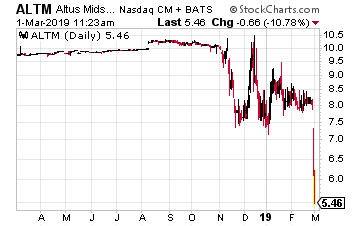
Altus Midstream Company (Nasdaq: ALTM) is a new energy midstream corporation that was formed in August 2018.
This is a “blank check” type of new company that will use the IPO proceeds to acquire energy gathering and pipeline assets.
ALTM is sponsored by Apache Corp. (NYSE: APA) and Kayne Anderson Acquisition Corp. The company has rights of first offer on five pipeline investments. The prospective acquisitions are worth over $3 billion. With its first quarterly earnings for the 2018 fourth quarter, the company had very little revenue and profits to report. Since the earnings, ALTM has dropped by 24%. Current market cap is $650 million.
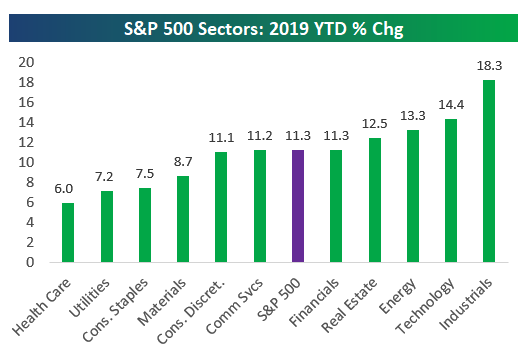
The Dow Jones Industrial Average and S&P 500 fell each of the final three trading days of the month, but all of the major U.S. stock indexes still finished February more than 3% higher. The result is the best two-month start for the S&P 500 since 1991.
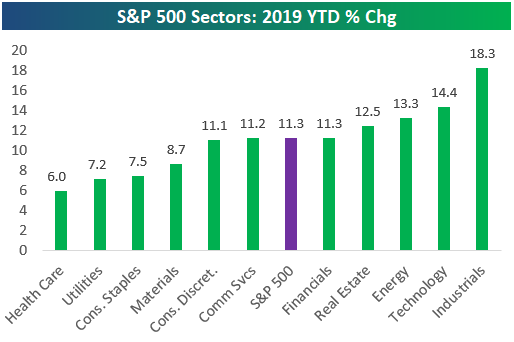
Investors have certainly been playing offense in the first two months of 2019, as the following chart shows. Industrial and technology names have led the way higher year-to-date, while defensive sectors (healthcare and utilities) have lagged.
Source: Bespoke Investment Group
Minimal Trade Progress in Asia
President Trump was in Vietnam this week, meeting with Kim Jong Un of North Korea. The talks abruptly ended on Thursday, as the two sides were unable to make progress amending U.S. economic sanctions and North Korea’s nuclear aspirations.
Earlier in the week, President Trump had pushed forward a March 1 deadline to consider enacting further tariffs against China. On Thursday, China reported a three-year low reading of its manufacturing Purchasing Managers’ Index, suggesting the economy is contracting.
U.S. Economy Hummin’ Along
Back at home, the economy appears alive and well, as evidenced by the GDP report on Thursday. The data showed 2.6% U.S. growth in the fourth quarter, which exceeded expectations.
Looking ahead to next week, the main economic focus will be the February jobs report on Friday. The consensus estimate calls for the addition of 185,000 non-farm payrolls and this number has generated a large upside surprise the past two months.
Retail on Earnings Calendar
While most traders were focused on the macro headlines this week, many companies back in the U.S. posted quarterly results. Retailer Best Buy (BBY) was the big winner, gaining 14% a day after posting robust holiday results. On the other hand, HP Inc. (HPQ) lost 18% the day after announcing disappointing sales.
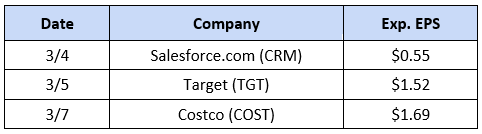
Retailers will continue to dominate the earnings calendar next week. In addition to the names highlighted below, Kroger (KR) and Ross Stores (ROST) will also offer a look into the health of the U.S. consumer.
U.S. stocks are off to the best start in nearly 30 years. After a sharp rally like this, some questions we usually hear are: “should I move my money around?” and “what’s still worth buying now?”
Market-timing, especially when to sell a big winner, is a decision that even experienced investors can struggle with.
However, if you’re nearing retirement or already retired, all you really care about is generating consistent income and protecting your hard-earned nest egg– not whether a company misses earnings expectations by a few pennies, or economic and political negotiations occurring halfway around the world.
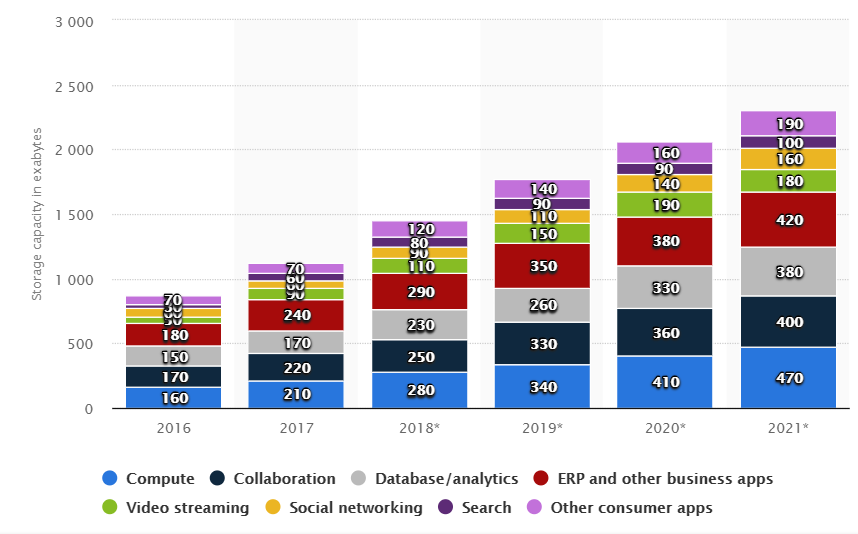
The multitudes faster 5G wireless technology will start rolling out around the globe over the next few years. Under the 4G system, mobile data has grown 17-fold over the past five years. Verizon predicts that 5G will allow data speeds up to 20 times faster than 4G. This means 20x as much data will be shared and much of it stored. The higher 5G speed will result in many more connections to the wireless network, including current wireline connected equipment and currently unconnected devices that will join the Internet of Things.
Exponential growth of data sharing means similar growth levels required for data storage. The tech industry, really all industries, rely on data centers for data storage. These are dedicated facilities with specific design feature to house servers, routers, switches, backup servers and the connections required to so data can be transmitted, accessed and stored. In the current world these are very large, high-tech facilities with advanced cooling and power generation capabilities. Data center storage is a growth business, as show by this chart showing data center storage data amounts for 2016 through 2021 from statista.com.
Data centers are a great, longer term way to participate in both 5G and data storage requirements growth. There are a handful of real estate investment trusts (REITs) that operate exclusively in providing data center services to the tech sector and other industries. Here are three to consider.
Equinix, Inc. (Nasdaq: EQIX) is the $35 billion market cap, the large-cap standard of the data center industry. The company converted from corporate tax payer to REIT status at the start of 2015. The company is a colocation and interconnection service provider. Colocation is a data center facility in which a business can rent space for servers and other computing hardware. Typically, a colocation facility provides the building, cooling, power, bandwidth and physical security while the customer provides servers and storage.
The company’s services currently give 9,500 customers 300,000 interconnects between data centers and world’s digital exchanges. According to the current Investor Overview presentation, Equinix owns over 200 data centers in 24 countries, on five continents. This is truly an international company. Over the last decade the company has produced in excess of 20% compounding annual revenue and EBITDA growth. This results in mid-teen per share cash flow growth.
For 2019 the company forecasts 11% FFO per share and dividend increases.
The shares currently yield 2.3%.
Digital Realty Trust, Inc. (NYSE: DLR) is a $24 billion market cap REIT that owns 198 data centers in 32 metropolitan areas. Digital Realty has over 2,300 customers.
Like Equinix, Digital Realty is also a colocation and interconnection services provider.
This REIT’s customer list includes some of the largest technology and telecommunications companies.
In the top 10 are IBM, Oracle, Verizon, Linked In, and even Equinix.
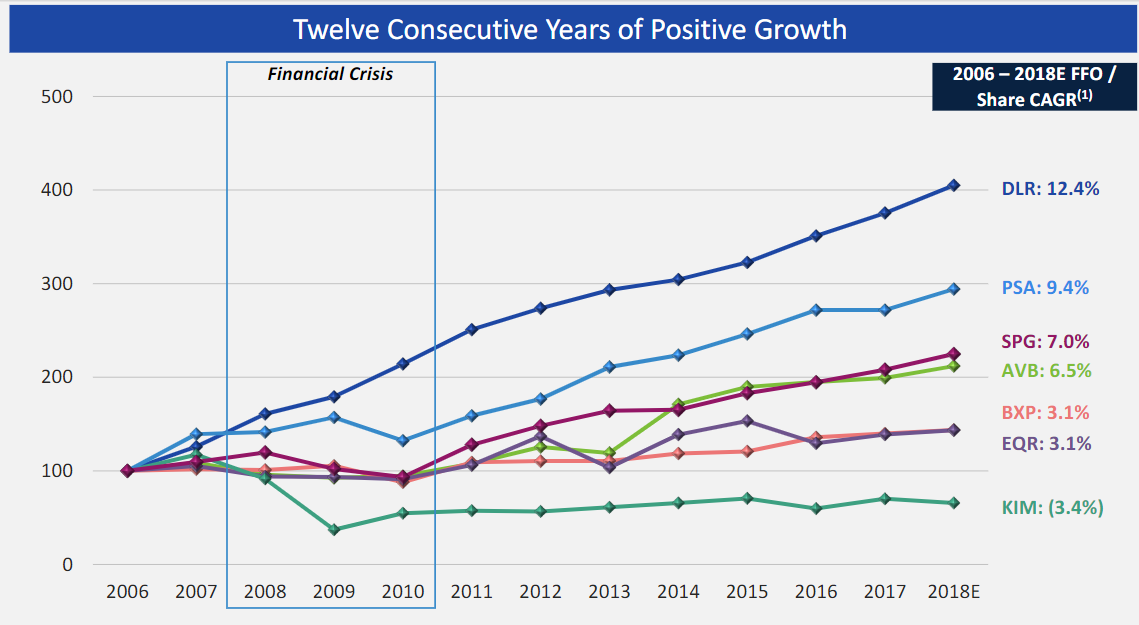
According to the current investor presentation, Digital Realty has grown FFO per share for 13 straight years. Over that period cash flow to pay dividends has grown by a compounding 12% per year.
This chart shows the FFO growth compared to large REITs in other sectors:
The DLR dividend has grown by 10% plus per year for the last decade. The shares currently yield 3.6%.
CoreSite Realty Corp (NYSE: COR) is a $3.9 billion market cap REIT that owns 22 data centers in eight strategic U.S. cities.
The company’s focus is to provide colocation services to enterprise, network, and cloud services companies. The company has over 1,300 current customers. CoreSite is the high growth, higher risk company out of the three covered here.
Since 2011, FFO per share has grown by 23% compounded and the dividend by more than 30% per year. Future results will cycle from relatively flat to high growth years. An investment in COR will not be as stable as with the large cap data center REITs. The flip side is the potential for large dividend increases and corresponding share price gains.
Today I’m going to show you a closed-end fund (CEF) yielding 13.7% that sounds—and is—too good to be true.
If you hold it, now is the time to sell.
The fund I’m talking about is Eagle Point Credit Company (ECC). Today we’re going to dive into all the reasons why ECC is a CEF to avoid. I’ll also give you five takeaway tips you can use to steer clear of funds like it in the future.
Let’s get started.
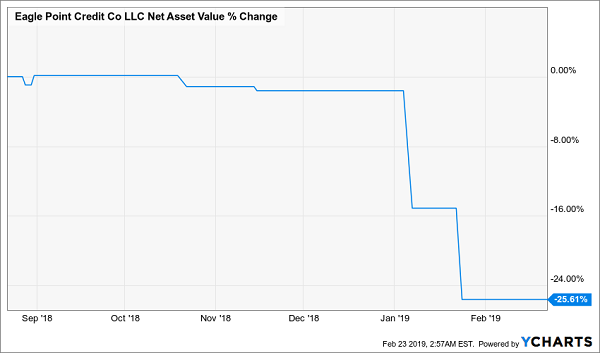
CEF Danger Sign No. 1: NAV and Market Price Go Haywire
As you can see below, ECC recently saw its net asset value, or NAV, plummet 26%, erasing three years of gains overnight:
ECC’s Underlying Portfolio Collapses …
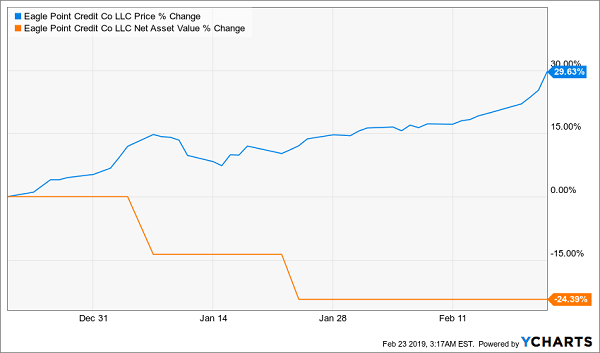
In a normal situation, you’d expect investors to sell fast. But in the world of CEFs, things don’t always happen that way. Zooming in on the past two months, when this NAV crush occurred, we see that the fund’s price actually soared.
… And Investors Cheer!?
This is obviously an extreme example, but when a CEF’s market price soars while its NAV heads south, it’s time to pay extra attention. Which leads me to my second red flag.
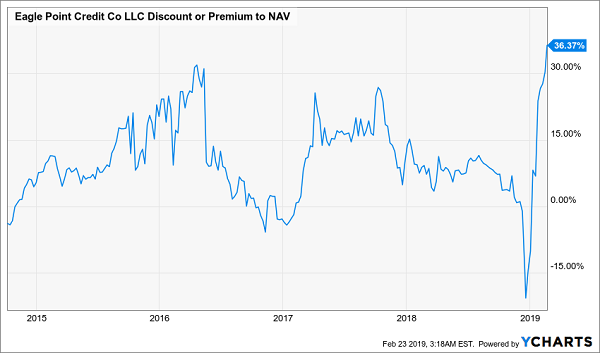
CEF Danger Sign No. 2: What Goes Up …
The widening chasm between ECC’s market price and NAV has put the fund’s investors in a dangerous spot, because it’s sent its premium to NAV soaring to the highest point in history in a very short period—and that can’t last. Check out this chart:
Stratospheric Premium Has One Way to Go
Such a poor NAV performance shouldn’t be rewarded with such a high premium, yet here we are. That leads us to the inevitable question: what caused ECC to lose a quarter of its NAV so quickly—and why didn’t investors respond immediately? Cue up my next warning sign.
CEF Danger Sign No. 3: The Fund Holds Complex, Hard-to-Value Investments
A major problem with ECC is that it only announces its official NAV with every quarterly earnings release, along with a rough estimate every month. This isn’t the norm for CEFs. Of the near-500 CEFs tracked by CEF Insider, 99% report NAV on a daily basis. But you don’t know what ECC’s portfolio is worth until it announces earnings each quarter.
This has to do with the collateralized loan obligations (CLOs) ECC invests in. CLOs are a type of derivative on loans similar to the mortgage-backed securities that tanked the economy in 2008.
CLOs pool a variety of loans, then cut these pools into sections investors can trade on the secondary market. These complicated assets aren’t traded daily, which makes it tough to mark them to market (or determine their NAV if they were all sold immediately). That’s why ECC only does this once a quarter.
As a result, you could buy ECC at what you think is a big discount only to find out, days or weeks later, that you actually bought at a premium.
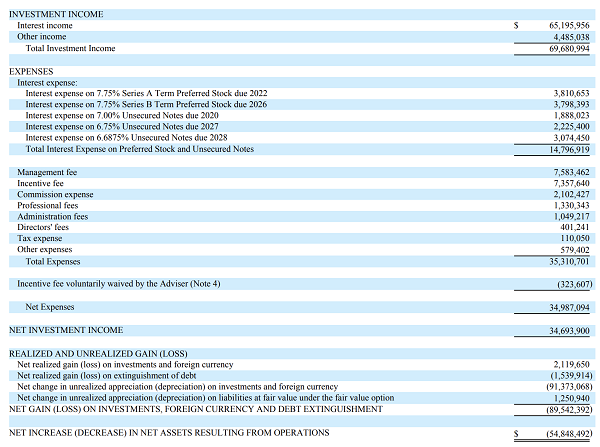
CEF Danger Sign #4: High Fees
ECC is also expensive from a fee perspective, as we can glean from the table below.
High Fees Hurt Shareholder Profits
Source: Securities and Exchange Commission
There’s a lot going on here, but you only need to look at two numbers: total investment income of $69,680,994 (near the top) and $34,987,094 in net expenses (two-thirds of the way down). Over half the fund’s profits went to a variety of fees! As a result, ECC’s fees amounted to a whopping 12.3% of its NAV in 2018.
CEF Danger Sign No. 5: A Shift in the Fund’s Sector
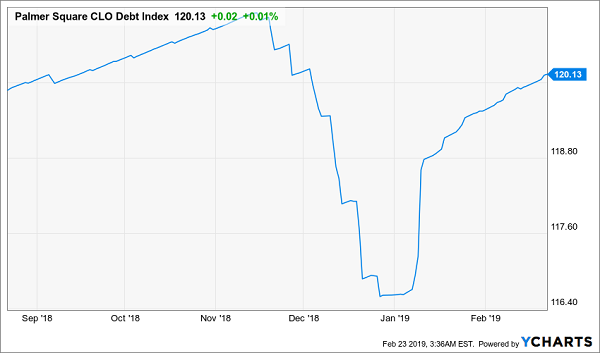
I’ve left the biggest reason for ECC’s underperformance for last: the late-2018 market crash and a sea change with CLOs themselves. If we look at the Palmer Square CLO Debt Index, we see that CLOs’ value took a hit at the end of 2018—as did just about everything else:
A Massive Drop for CLOs
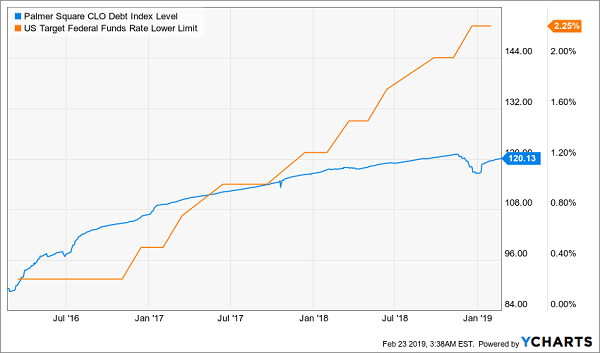
As a CLO fund, ECC is expected to drop with the index, but we should still ask why the index plunged in the first place. Late 2018’s selloff is part of the story, but interest rates are another part. That’s because CLOs have benefited from the rising-rate environment we’ve seen since 2015, as higher rates boost their interest income:
CLOs Rise With Rates
However, the Federal Reserve has made it clear that the aggressive rate-hike plans it laid out in 2018 won’t happen in 2019. And the fact that CLOs had priced in a long string of rate increases caused them to crash in late 2018.
They should have stayed down, but irrational exuberance kicked in, making CLOs—and ECC itself—overvalued again.
Let’s face it: this frothy market has made it much tougher to uncover the big, cheap dividends you need to fill out your retirement portfolio. So today we’re going to fight back with my top 2 “off-the-record” strategies for honing in on 7.4%+ dividends that still have a lot of upside ahead.
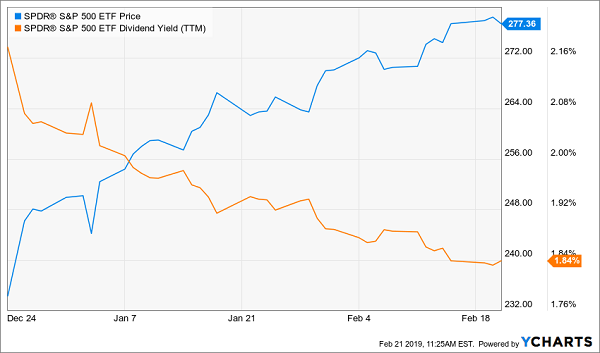
First, to get a sense of the vice the rebound has locked income investors in, check out this chart:
Stock Bounce Crushes Yields
That amounts to an 18% bounce since Christmas Eve, which has sliced 15% off the S&P 500’s dividend yield (because yields fall as prices rise). As I write, the average S&P 500 name dribbles out a 1.9% payout—less than inflation!
Which brings me to the first strategy I’ll show you today.
Contrarian Tip No. 1: When They Go Short, We Go Long
Short interest is one of my favorite ways to “time” stock buys.
If you’re unfamiliar, short selling involves selling a stock you’ve borrowed, with a commitment to buy it back later, hopefully at a lower price. Your profit lies in the difference between the selling price and the price at which you have to buy it back.
It’s a dangerous path that can expose you to unlimited losses (because there’s no limit on how high a stock can rise, while your “regular” buys can only go to zero).
But don’t worry—we’re not going to “short” stocks ourselves. Instead, we’re going to sit back and cash in on the short sellers’ greed.
Here’s how: if a stock attracts a lot of short interest and the price moves up, the “shorts” will scramble to buy and cover their positions. That’s great for us because it can create a “feedback loop” where the rising price triggers short covering, driving the price higher, triggering more short covering, and so on.
All we have to do is relax, let the chaos unfold, and watch our stock rocket higher! And these “squeezes” can be truly epic, like the one that caused Volkswagen to explode 82% in a single day in 2008.
So how do we find our own Volkswagen (and better yet, one with a 7%+ dividend)?
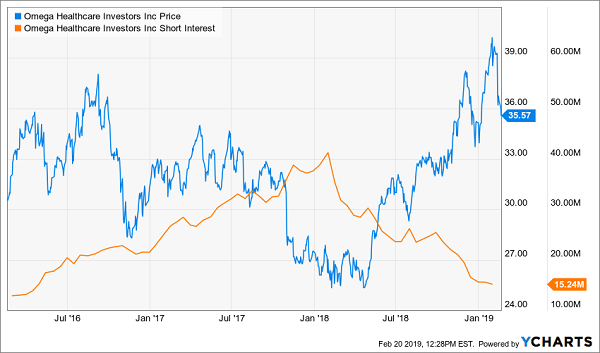
A good rule is that short sellers tend to be the most wrong at the extremes, so we’ll look for short interest that’s wayhigher than usual, then jump in. You can see this in action with Omega Healthcare Investors (OHI), a real estate investment trust (REIT) I’ve recommended in my Contrarian Income Report service:
Short Covering Sends OHI Ripping Higher
Notice how rising short interest kept a lid on OHI’s price, until it peaked in January 2018? If you’d jumped in then, you would have bagged a 35% price gain in just over a year, as short covering helped pry the stock higher.
And that’s just in price gains! Never mind that OHI pays a 7.4% dividend now (and would have paid nearly 10% when short interest peaked). Throw the payout in, and your gain jumps to 48%in just one year.
So much for the common “wisdom” that you can’t get big gains and big dividends from a single stock!
Now let’s move on to our next contrarian buy signal.
Contrarian Tip No. 2: Check In as Analysts Check Out
You can catch another big windfall by paying close attention to analyst ratings—but not the way most people think.
Remember, everyone loves to follow the herd, and analysts are often the lead lemmings. That’s why, when most folks research a stock, they look for those with a lot of buy ratings from Wall Street—if they look at these ratings at all.
But they’ve got it backwards! Because if every analyst already has a buy rating on a company, there’s no hope of upgrades, which can send shares stair-stepping higher.
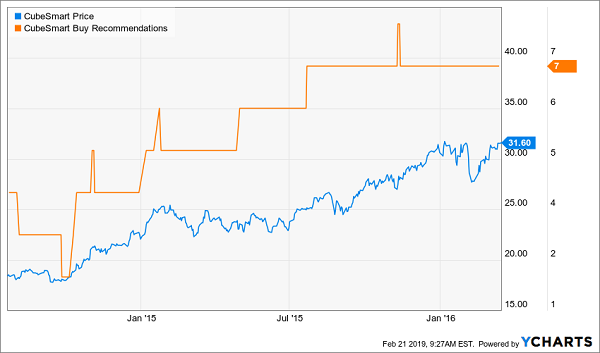
That’s what happened with self-storage REIT CubeSmart (CUBE), payer of a 4.2% dividend that’s skyrocketed in the last five years. As you can see below, CUBE’s shares nearly doubled from June 2014 to March 2016, as the number of analysts recommending it also nearly doubled, from four to seven.
Wall Street Optimism Drives an Easy Double …
Fast-forward to today, and just one analyst has a “buy” on CUBE, even though the Federal Reserve has halted further rate hikes, a big plus for the entire REIT sector. That sets the stock up for another strong run as analysts climb back aboard.
21 Cash-Spinning Buys for 7.5% Payouts and BIG Gains
Here’s the roadblock most regular folks slam into with “second level” indicators like these: the big brokerages keep ALL of this powerful research to themselves!
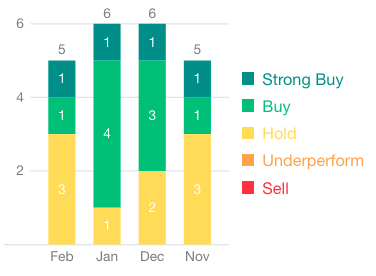
Free services, like Yahoo Finance, give us crumbs, with buy recommendations limited to just the last four months. Basing a buy decision on that tiny slice of data could send you straight off a cliff.
Don’t Buy ANY Stock Based on This!
Source: Yahoo! Finance
Finding short interest is even harder. Your only real option here is a paid service like Ycharts, but that will set you back hundreds of dollars a year!
Stock-market selloffs provide great times to buy big dividends. The stock market was a relentlessly receding tide in the fourth quarter, which is bad for “buy and hope” investors but quite helpful for income specialists like us.
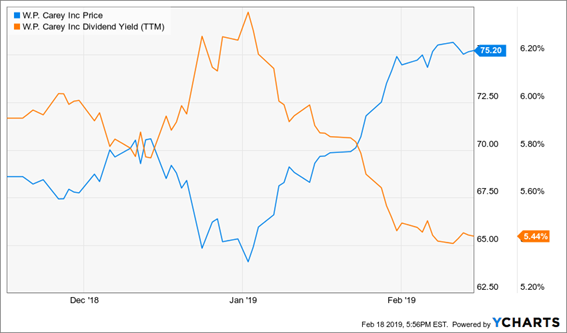
Let’s consider high-quality real estate investment trust W.P. Carey (WPC). This REIT looks good at most prices, but the market gave us an exaggerated dip in December-early January that spiked its yield to nearly 6.5%. Savvy, patient investors who bought on this dip (like my Contrarian Income Report subscribers) didn’t just enjoy an excellent yield on the higher end of its five-year range – they also are sitting on 17% gains in just a matter of weeks!
W.P. Carey (WPC): Why It Pays to Wait for Dividend Deals
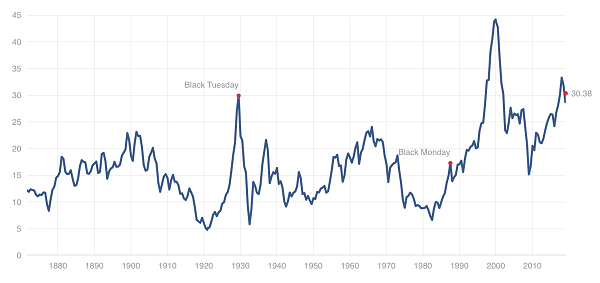
The problem for bargain hunters right now is that the market’s red-hot 2019 recovery has brought many stocks back to the bloated valuations they traded at before the fourth quarter provided a little valuation relief.
In fact, we’re still in the midst of one of the most expensive markets ever.
If You’re Buying Stocks Right Now, You’re Probably Overpaying
Source: Multpl.com
But there are a few deep values left in this marked-up market. A few stocks I’ve been monitoring have been pared by between 25% and 65% in less than a year. And as a result, these battered dividend plays, which typically yield 3%-4%, are dishing out yields between 5.3% and 6.6%!
That’s good. Plus these deep discounts also mean there’s potential for short-term pops of 20% or more.
Of course each of these firms has business hurdles to overcome. Let’s dig in to dividend stock bargain bin:
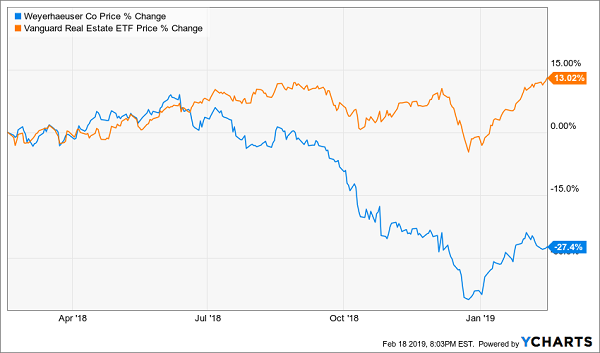
Weyerhaeuser (WY) Dividend Yield: 5.3%
REITs have held up pretty well over the past half-year or so, which makes timber real estate play Weyerhaeuser’s (WY) performance since July stick out like a sore, black-and-blue thumb.
Weyerhaeuser (WY) Has Been Taken to the Woodshed
The primary tailwind on Weyerhaeuser? The Fed.
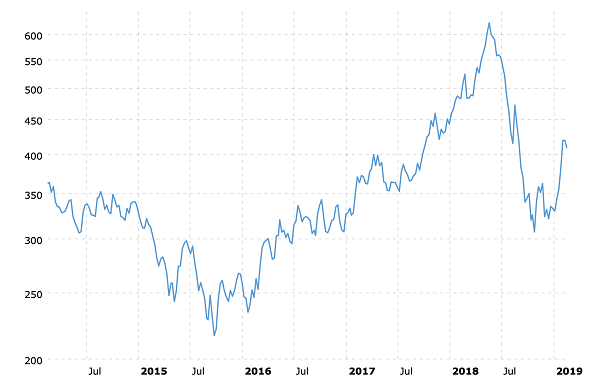
In short, the Federal Reserve’s ramping up of interest rates finally started to weigh on the housing market in a big way, which in turn finally popped a bubble in lumber prices that had been keeping WY aloft.
Source: MacroTrends.net
There are a few things to like about Weyerhaeuser. Timber is a very niche REIT realm, providing some serious diversification, and the company has been a beacon of dividend growth, upping its annual payout every year since converting into a real estate investment trust in 2010. And prior to its lumber-related plunge last year, it had outperformed the Vanguard REIT ETF (VNQ) by 135% to 86% on a total return basis over the past decade.
But is WY a value?
While lumber prices appear to be stabilizing, they’re still doing so at levels considerably lower than their 2018 highs. Moreover slower rate hikes from the Federal Reserve will take a little pressure off the housing market. But the data is still grim. November housing starts (the last available data thanks to the temporary government shutdown) showed single-family starts at a 1 ½-year low. Third-party gauges for December activity, namely permits, also were in a downtrend.
The dividend is a potential problem, though. Weyerhaeuser did improve the payout again last year, in August, by 6.3%. But the company paid out $995 million in dividends against $748 million in profits last year, and its projected annual payout of $1.36 per share in 2019 is far more than analysts’ expectations for 83 cents in profits.
This could be a short-term bump in the road, but the path out isn’t clear yet. That, combined with the dividend situation, makes WY look less like a value, and more like a high-yield value trap.
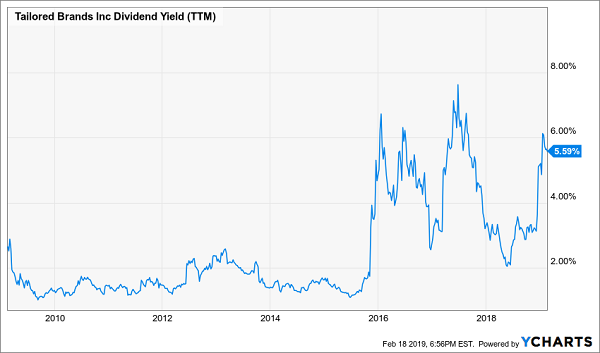
Tailored Brands (TLRD) Dividend Yield: 5.6%
Tailored Brands (TLRD) isn’t a familiar name outside the investing space, but most people will know its two primary brands: Men’s Wearhouse and Jos. A. Bank. The men’s suit stores engaged in a nasty bout of M&A maneuvering starting in October 2013 before eventually completing a merger in June 2014. Men’s Wearhouse switched to a holding-company structure in January 2016, adopting the Tailored Brands moniker in 2016.
Shares have been bludgeoned over the past year, losing roughly two-thirds of their value since May 2018. Some of the biggest hits included disappointing same-store sales growth in June, a report in December that Men’s Wearhouse traffic was sliding (thanks to several factors, including increased competition from the likes of Bonobos) and another report in January in which the company lowered its fourth-quarter guidance on weakness at Jos. A. Bank.
What’s to like about this apparent train wreck?
For one, the yield on TLRD is now well north of 5%, which is on the very high end of its range since the merger. But despite the company’s woes, it will pay out just 32% of its expected full-year earnings ($2.28 per share) in dividends. In short, the payout is extremely safe for a company that has been trounced so hard.
Another Yield Spike for Tailored Brands (TLRD)
At the same time, TLRD is making strides on paying out its debt. The stock also is a deep value at these levels, trading at just five times future earnings estimates. And despite its woes, analysts still see the Tailored Brands averaging high-single-digit profit growth over the next half-decade.
But cheap stocks can get even cheaper.
Tailored Brands warned significantly on comps, but said it wasn’t sure why they had weakened so much. They’re so much of an outlier compared to past quarters, in fact, that this could just be a blip on the radar. If so, TLRD could be a dividend-and-value double play. But if this is a glimpse into a shift in consumer tastes, Tailored Brands will be forced between a rock (falling sales) and a hard place (returning to deep discounts, slicing margins).
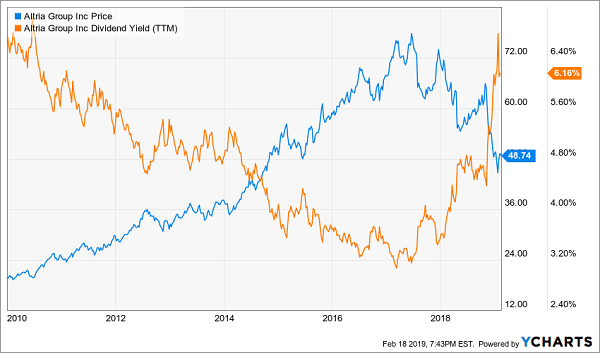
Altria (MO) Dividend Yield: 6.6%
I’ve warned about the long-term difficulties facing cigarette maker Altria (MO) for some time – namely, that the U.S. is in a never-ending crackdown on cigarettes, threatening the company’s core business. Shares have indeed been caught in a downward trend since 2017, but reality really started to catch up with Altria in Q4 2018, as shares plunged far deeper than the broader market. Now MO sits about 15% lower than where it was the last time I cautioned my readers on the stock.
But maybe, just maybe, there’s a contrarian play here?
Wells Fargo seems to think so. Analyst Bonnie Herzog, who rates the stock “Outperform” and has a $65 price target that implies 33% upside from here, doesn’t see any end to Altria’s decline in cigarette sales. But she does think vaping might be the company’s savior, pointing to the company’s $13 billion, 35% stake in e-cigarette maker Juul, announced in December. The money quote:
“One of the key points that continues to be misunderstood, in our view, is that while MO’s cigarette volumes will likely decelerate faster…, the incrementality from MO’s stake in JUUL — strong U.S. share/margin growth and huge upside internationally — is underestimated since we predict MO’s equity income from JUUL will more than offset MO’s shrinking cigarette volume pool.”
And like Tailored Brands, Altria is at least showing big value-and-income numbers. Its yield has plumped up to north of 6%, and its forward P/E of 11 is well, well below the market average.
Altria’s (MO) Yield Hasn’t Been This High Since the Turn of the Decade
Credit where credit is due: Altria isn’t sitting around praying that cigarette sales will magically recover. The investment in Juul was a pricey risk, but one the company needs to take if it wants to stave away irrelevance as its core product deteriorates into a pile of legislative ash.
That said, Juul isn’t immune from the same pressures. The company faces class-action lawsuits in Philadelphia and New York federal courts over the company’s marketing tactics and over its disclosure of nicotine levels. Juul also temporarily halted sales of most of its flavored nicotine pods in November in hopes of getting out in front of aggressive federal regulators worried about spiking e-cigarette use.
If this sounds familiar, it should. This is the same treatment cigarettes have gotten for years … and why Altria still could be in trouble long-term despite its creative wheeling and dealing.
Live Off Dividends Forever With This “Ultimate” Retirement Portfolio
If you’re mapping out a successful retirement portfolio, these three stocks illustrate the right idea: high yields with price potential. We all know you need enough income to cover all of your regular expenses, but investors often overlook the importance of growing their nest egg in retirement – that way, if the unexpected happens, you won’t cripple your dividend-producing potential to dig out of trouble.
But you also need security – and you can’t do that by taking flyers out on deeply troubled stocks like the three picks I just covered.
Brett Owens, Chief Investment Strategist Updated: February 20, 2019
It’s a question I get from investors all the time: “Should I take my dividends in cash or reinvest them through a dividend reinvestment plan (DRIP)?”
My answer: unless you want your cash sitting in your account earning zero, your best bet is to reinvest any dividend money you don’t need to pay your bills.
But we don’t want to practice “buy and hope” investing, either, whether we do it through obsolete DRIPs or the old-fashioned way.
When I say “buy and hope,” I mean putting your cash into household names like the so-called Dividend Aristocrats and “hoping” for higher stock prices when you cash out in retirement.
You’ve probably heard of the 57 stocks on the Aristocrats list, which have raised their payouts for at least 25 straight years. Trouble is, despite their lofty name, these companies hand us a pathetic current dividend of 2.2%, on average. And quite a few pay less than that:
5 Dividend Paupers
So if you invest mainly in the average Dividend Aristocrat (as many people do), you won’t have to worry about reinvesting your dividends. You’ll need every penny of dividend income just to keep the lights on!
That’s because even with a $1-million portfolio, you’re only getting $22,000 in dividend income a year here, on average. That’s not far above poverty-level income for a two-person household.
Pretty sad after a lifetime of saving and investing.
Luckily, there’s a way we can rake in way more dividend cash. I’m talking a steady $75,000 a year in income on a million bucks. And if you’re not a millionaire, don’t worry: a $550k nest egg will bring in $41,200 annually, enough for many folks to retire on.
That’s nearly double the income on our million-dollar Aristocrat portfolio, from a nest egg that’s a little over half the size!
How to Bank an Extra $41,200 in Cash Every Year
I know what you’re thinking: “Brett, that amounts to a 7.5% yield. There’s no way a payout like that can be safe.”
You can be forgiven for thinking that, because you hear it everywhere. But the truth is, there are plenty of safe payers throwing off at least that much, like the 21 stocks and funds in my Contrarian Income Report service’s portfolio (which I’ll show you when you click here).
Right now, these 21 sturdy investments yield 7.5%, on average. And every month I personally run each one through a rigorous dividend-safety check, starting with three things that are absolutely critical:
Rising free cash flow (FCF)—unlike net income, which is an accounting measure that can be manipulated, FCF is a snapshot of how much cash a company is making once it’s paid the cost of maintaining and growing its business;
A payout ratio of 50% or less. The payout ratio is the percentage of FCF that went out the door as dividends in the last 12 months. Real estate investment trusts (REITs) use a different measure called funds from operations (FFO) and can handle higher payout ratios, sometimes up to 90%;
A healthy balance sheet, with ample cash on hand and reasonable debt.
Making DRIPs Obsolete
The best part is, these 21 investments are perfect for dividend reinvestment because each one gives us a dead-giveaway signal of when it’s time to buy, sit tight—or sell and look elsewhere for upside to go with our 7.5%+ income stream.
That makes DRIPs obsolete!
Because why would we mindlessly roll our dividend cash into a particular stock every quarter when, at a glance, we can pinpoint exactly where to strike for the biggest upside?
To show you what I mean, consider closed-end funds (CEFs), an overlooked corner of the market where dividends of 7.5% and up are common. We hold 11 CEFs in our Contrarian Income Reportportfolio, mainly larger issues with market caps of $1 billion or higher.
We don’t have to get into the weeds, but CEFs give off a crystal-clear signal that a big price rise is coming. You’ll find it in the discount to NAV, which is the percentage by which the fund’s market price trails the market value of all the assets in its portfolio.
This number is easy to spot and available on pretty well any fund screener.
This makes our plan simple: wait for the discount to sink below its normal level and make your move. Then keep rolling your dividend cash into that fund until its discount reverts to “normal.”
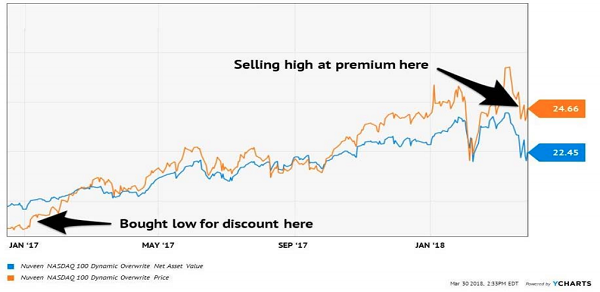
That’s exactly what we did with the Nuveen NASDAQ 100 Dynamic Overwrite Fund (QQQX)back in January 2017—and the results were breathtaking.
How We Bagged a 40% Total Return (With a 7.5% Yield) in 15 Months
QQQX’s management team cherry picks the best stocks on the NASDAQ, juices their high yields with a low-risk options strategy, then dishes distributions out to shareholders. Back on January 6, 2017, QQQX was trading at a 6% discount to NAV and paid a 7.5% dividend.
That triggered our initial move into the fund. And over the next 15 months, we bagged two dividend increases and watched as QQQX’s discount swung to a massive premium—so much so that by the end of that period, the herd was ready to ante up $1.13 for every buck of assets in QQQX’s portfolio!
Discount Window Slams Shut…
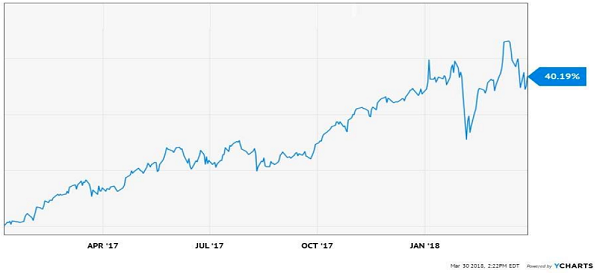
That huge swing from a discount to a premium catapulted us to a fat 40% gain (including dividends). But the fund’s outrageous premium meant its upside was pretty well maxed out by the time we took our money off the table on April 6, 2018.
… and Delivers a Fast 40% Gain
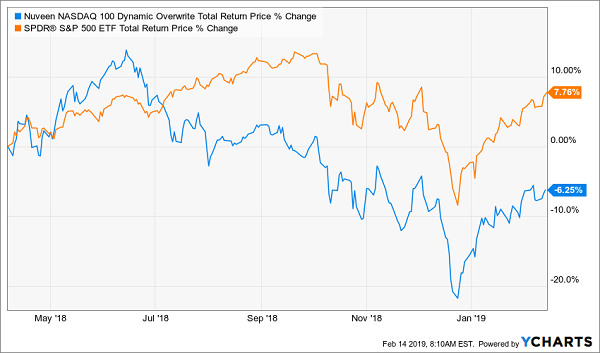
And what’s happened since?
QQQX has plunged 6% (including dividends!), far underperforming the market’s 7.8% total return.
Premium Gives Us the Perfect Exit
Forget QQQX: Grab These 8% Monthly Dividends Instead
Here’s the punchline on QQQX: despite the loss it’s posted since last spring, it still trades at a 2% premium to NAV!
Why the heck would we overpay when the ridiculously inefficient CEF market is throwing us bargain after bargain as I write this?
There’s one more thing I have to tell you: many of these cheap CEFs pay dividends monthly instead of quarterly. So if you hold them in your retirement portfolio, their massive dividend payouts will roll in on exactly the same schedule as your monthly bills!
Convenience isn’t the only reason to love monthly payers, though. Because they also let you reinvest your payouts faster, amplifying your gains (and income stream) as you do.
I’m talking about an automatic “set-it-and-forget-it” CASH machine here!
The best news? You can kick-start your monthly income stream without doing a single moment of legwork … because I’ve done it all for you.
There is a tremendous appeal to owning shares of high-yield stocks. In a world where you are lucky if a bank account pays 2%, income stocks that pay 8%, 9% or even 11% can be very attractive. However, high yield stocks are not a bank account or government bond. Dividend cuts happen and when they do, investors get the double pain of a reduced income stream and a steep drop in share prices. If you want to build a high yield income stream, the primary skill to acquire is how to separate the dangerous high-yield stocks from the more secure ones.
Dividend stocks trade to provide high dividend yields for a reason. The market (as in the whole investing public that is buying or selling an individual stock) believes there is chance the current dividend rate will be cut. The higher the yield, the more the market is pricing in the probability of a dividend reduction. Now here’s the fun part. Whether the dividend is actually reduced is a binary outcome. Either it will be cut, or the company will continue to pay the current dividend rate. Many high-yield stocks continue to pay the dividends for years. The number of dividend cuts each year tend to be a small percentage of the high-yield universe.
Thus, the goal of the income stock investor is to own high-yield stocks with low probabilities of dividend cuts and avoid the ones where the potential of a dividend reduction is high. To do so you need to understand how each individual company generates cash flow to pay dividends. Avoid those where the cash flow per share is at risk due to iffy business operations or a fundamental flaw in the business model. Here are three high yield stocks to sell or avoid.
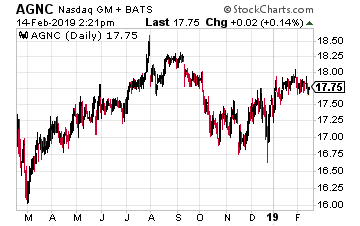
AGNC Investment Corp (Nasdaq: AGNC) is the largest of a group of companies that own portfolios of government agency backed mortgage backed securities (MBS). You will see these referred to as Freddie Mac, Fannie Mae and Ginnie May mortgage-backed bonds.
The challenge for AGNC and all the agency MBS owning finance REITs is taking the 3.5% yield of the bonds up to a double digit stock yield. The step is done with large amounts of leverage. An agency MBS owning REIT will leverage its equity 5 to 10 times with borrowed money.
For the 2018 fourth quarter AGNC reported leverage of 9.0 times book value. The problem with this amount of leverage is that a flattening of the yield curve can wipe out the net interest margin and the ability to continue paying dividends. A steepening of the yield curve will result in falling prices in the MBS portfolio. The lenders providing the leverage can force the REIT to sell bonds at a loss to bring down the leverage.
REITs like AGNC are better for management compensation than they are for investors looking for stable dividend payments. The AGNC dividend has shrunk by 14% per year on average over the last five years.
Ignore the 12% yield and sell.
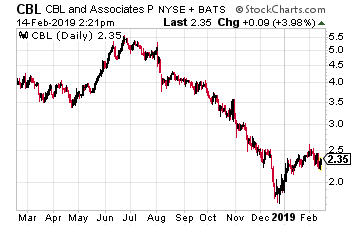
CBL & Associates Properties, Inc. (NYSE: CBL) is a shopping mall REIT on the wrong side of the shopping center great divide. At one end are the REITs that own Class A malls which are 95% plus occupied with successful retailers. At the other end are the REITs that own malls with fading demographics anchored by declining retailers like Sears and JC Penny.
These second tier malls will require millions in capital spending to make them again attractive to shoppers, and that spending may not do the trick. Shoppers are fickle, and it may be impossible to draw them back to a near failed mall.
It’s easy to tell the difference between the successful mall REITs and the trouble ones. The good REITs in this category have yields under 5%. The challenged ones have double digit yields. In the case of mall REITs, the high yield is a true danger signal to sell and stay away.
CBL yields 13.3%.
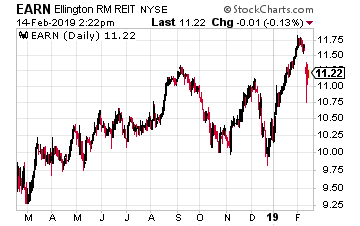
Ellington Residential Mortgage REIT (NYSE: EARN) is another residential agency MBS owning finance REIT. This company has many strikes against it.
First, it is a very small cap with only $141 million market value. This size makes Ellington very susceptible to be “taken down” by the large banks when interest rates get volatile. This happened to many residential REITs during the 2007-2008 financial crisis.
Second, the company currently has an 8.7 to 1 leverage of its equity to support the high yield.
Third, the net interest margin on the portfolio is just 1.1%. A one-quarter percent increase in short term rates could wipe out almost 25% of the spread, resulting in a big dividend cut. Three strikes and you are out for EARN.