Buy This 17% High-Yield Stock Selling at a Temporary Discount

Last week a Federal Energy Regulatory Commission (FERC) ruling sent the MLP and energy infrastructure stocks into a tailspin. The news release caused an immediate 10% drop in the MLP indexes. Prices recovered to close at a 5% decline. A closer read of the facts shows the fears were overblown and this steep drop may end up in hindsight as the MLP sector’s equivalent of the March 2009 bottom of the last stock bear market.

Here is the scary headline from Bloomberg:

Pipeline Stocks Plunge After FERC Kills Key Income-Tax Allowance

The reality is that the ruling only applies to interstate (not intrastate, which is most pipeline miles) pipelines and to just one of the methods a pipeline company can use to set interstate transport rates. Here is how large cap MLP Magellan Midstream Partners, L.P. (NYSE: MMP) explains the effect of the FERC ruling on its business:

“Although Magellan is organized as an MLP, it does not have cost-of-service rates that would be directly impacted by this policy change. Rather, the rates on approximately 40% of the shipments on Magellan’s refined products pipeline system are regulated by the FERC primarily through an index methodology. As an alternative to cost-of-service or index-based rates, interstate pipeline companies may establish rates by obtaining authority to charge market-based rates in competitive markets or by negotiation with unaffiliated shippers. Approximately 60% of Magellan’s refined products pipeline system’s markets are either subject to regulations by the related state or approved for market-based rates by the FERC. In addition, most of the tariffs on Magellan’s crude oil pipelines are established by negotiated rates that generally provide for annual adjustments in line with changes in the FERC index, subject to certain modifications.”

Numerous other large cap MLPs and corporate pipeline companies have issued press releases to state that their business results will not be affected by the FERC ruling. It appears that few pipelines have rates set using the “cost of service” rules.

Related: A High-Yield Stock That’s Better at 15% Than One at 20%

In the bigger picture, MLP values have been falling since late January. Over the same period companies in the sector reported 2017 fourth quarter results that were very positive. MLP fundamentals have been improving for several quarters, and the trend will continue as North American oil and gas production continues to grow.

15 MLPs in the Alerian MLP Infrastructure Index raised distributions and the other 10 kept them level. There were no reductions. This combination of falling market values against strong fundamentals reminds me very much of the bottom of the last bear market which occurred in March 2009. At that time, it seemed that nothing would stop the market decline. In hindsight that point in time was when stocks reached what I politely call “stupidly cheap” prices. Currently quality MLPs look “stupidly cheap.”

Here are the bear market charts of the SPDR S&P 500 ETF (NYSE: SPY) for the 2007 to 2009 bear market compared to the Alerian MLP ETF (NYSE: AMLP) bear market which started in February 2017. If MLPs form a bottom here, the pattern points to significant gains over the next few years.

If you own quality MLPs that have fallen in value, it is a good time to add more to your positions. In my Dividend Hunter newsletter, my primary MLP recommendation is the InfraCap MLP ETF (NYSE: AMZA). This ETF pays monthly dividends which benefit from option selling by the fund managers. After the big FERC fueled drop, AMZA yields over 17%.


Dump These 3 Steel Stocks as Tariff’s Rip Up the Industry

The imposition of a 25% tariff on imported steel by President Trump has certainly been a headline grabber. But it obscures the long-term problems faced by the U.S. steel industry.

And it only addresses one side of the classic economic equation for any commodity – supply and the industry’s struggle against cheap imports. The share of the U.S. steel market taken by imports was only 26.9% in 2017, up slightly from 2016’s level of 25.4%.

The other part of the equation is demand and that remains a sore spot. There is a genuine long-term weakness in domestic demand for steel. The only bright spots on that front are the auto and the shale oil and gas industries.

Related: Trump’s Trade War Set to Cost This Automaker $1 Billion: Sell Now

The decline in U.S. steel output since the 1970s is clearly seen in this graph. 2017 estimated steel use in the U.S. was 110 million metric tons, which was far below the 136 million ton level in 2006, before the financial crisis. U.S. steel production was up 3% in 2017, but capacity utilization remains low at 74%. In other words, there is still overcapacity in the U.S. steel industry based on current demand.

And the situation could get worse. . . . .

Higher Prices = Lower Demand

A basic economic principle is that higher prices lead to lower demand. And the steel tariffs mean higher prices for manufacturers in the United States that use steel. So unless US steel-using manufacturers are also protected from imports by tariffs, they will end up being losers on the global stage because the higher steel cost will make them uncompetitive. That’s the slippery slope you get on when you begin imposing tariffs – you have to end up shielding more and more industries.

Before Trump acted to impose tariffs on steel, forecasters had been predicting a decent year for the steelmakers. Growth in steel demand, as forecast by the consultancy Wood Mackenzie and others, was expected to be in the 7% range. But if higher costs start pricing US manufacturers out of world markets, that expected rise in demand will quickly disappear and jobs could even be lost.

The solution – instead of tariffs – would have been to begin moving forward on President Trump’s dream of rebuilding America’s deteriorating infrastructure. For example, there are more than 54,000 bridges in the United States that need to be repaired or replaced, according to the American Road and Transportation Builders Association. Just think about how much steel would be needed to just tackle that problem.

And there’s a whole lot more in infrastructure that needs to be done… that’s why the American Society of Civil Engineers most recent report card gave U.S. infrastructure an overall grade of D+. The report also said that if our country’s investment gap is not addressed by 2025, the U.S. economy will lose nearly $4 trillion in GDP.

In simple terms, if you want to be competitive globally in the 21st century, you need a 21st century infrastructure and not one a hundred years old.

Stay Away From Steel Stocks

I do not expect the United States to seriously address its infrastructure problem. Therefore, I do not see additional demand coming online any time soon for U.S. steelmakers. And there is a related problem the U.S. steel companies have…

That is, some of their mills are simply inefficient and uncompetitive. This has been a decades-long problem for the U.S. steel industry, even going back to just after World War II. U.S. steel producers held on stubbornly to old technology – the so-called ‘open hearth’ steel production method. Meantime, the Europeans and everyone else adopted the more efficient ‘basic oxygen’ process.

Of course, other newer steelmaking technologies are in use today, but the roots of the decline of the American industry began then. By the time the U.S. steel industry modernized (after begging for protection against those darn foreigners), it had already lost its spot as the world’s steel kingpin.

As the famous quote attributed to Mark Twain says, “History doesn’t repeat itself, but it often rhymes.”

Therefore, I expect the benefits of the tariffs to the steel companies to disappear as quickly as a morning fog on a hot summer day.

This makes the stocks of the steel companies un-investable or, if you have a high risk tolerance, outright shorts. Especially at these elevated price levels, which seemed to have all the possible good news already factored in.

Related: Here’s Why You Need to Buy These 3 Metals Stocks Today

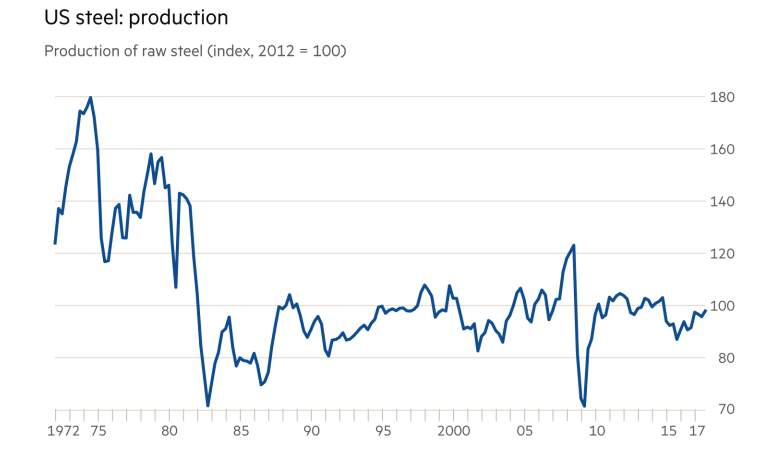
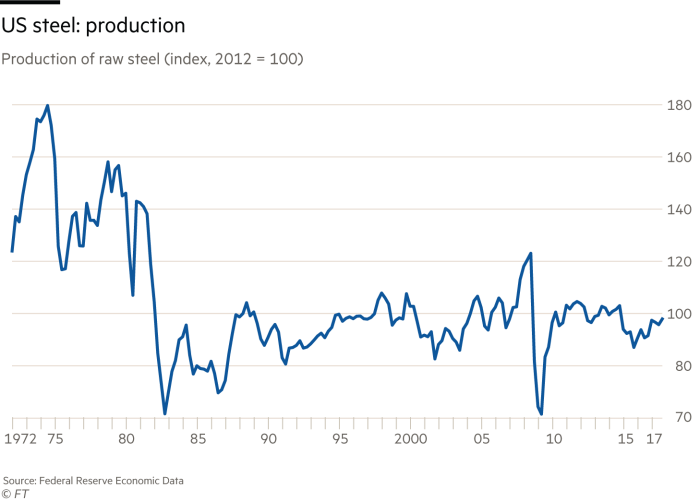
At the top of the list of steel stocks to avoid is U.S. Steel (NYSE: X), which saddens me because my grandfather used to work for the company.

Vertical Research Group analyst Gordon Johnson recently said on CNBC that the operating costs for the company are up, meaning the tariffs will offer little benefit.  Johnson specifically pointed to the soon-to-be-reopened Granite City mill in Illinois as “one of the least efficient steel mills in the world”.

U.S. Steel is also facing operational issues in its flat-rolled division with increased outage and plant maintenance costs rising. The company sees higher plant-related spending as it accelerates its efforts to revitalize this unit. Maintenance and outage expenses for the flat-rolled unit for 2017 increased by $341 million on a year over year basis. The company expects maintenance and outage spending for 2018 to be similar to 2017.

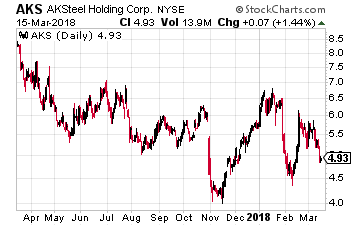
The second stock on the no-touch list is AK Steel Holding (NYSE: AKS). Like U.S. Steel, it faces planned maintenance outages in some facilities, affecting production. The company recorded outage costs of $85 million in 2017 and in 2018, it expects expenses associated with planned outages to be about $50 million.

But there are other, bigger problems for AK Steel. AK Steel’s cost structure is higher than its peers due to its greater reliance on external supplies of raw materials. It pays nearly double for iron ore pellets compared to its integrated competitors, who consume their own pellets. The company saw higher year over year costs for raw materials such as iron ore and other alloys in the fourth quarter and raw material cost inflation is expected to continue throughout the year.

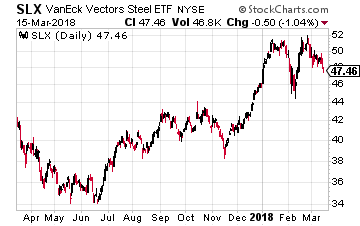
Finally, a broad way to play the chronic overcapacity in the global steel industry is through an exchange traded fund – the VanEck Vectors Steel ETF (NYSE: SLX).

The top positions in the fund (27 stocks make up the fund) are the mining firms that produce the aforementioned raw materials needed for steel production like iron ore. However, it is still loaded with steel-producing companies from all over the world. About half the stocks in the portfolio are U.S. steel industry companies.

It would not surprise me to see this ETF slide from its current price near $50 into the $30s or even $20s.

Get Your Hands on Stocks Growing Revenues (and Stock Prices!) Faster than Google and Apple

I’d like to reveal to you the blue chip stocks – one in particular – that could literally be worth millions of dollars to you over the next decade.

Revenue for one firm in particular is growing faster than that of Google and Apple, the darlings of Wall Street. Investors have watched the stock price shoot up over 100% this past year and we’re just getting started.

You need to get in this stock before April 1st (it’s closer than you think!).

Get up to 14 dividend paychecks per month from safe, reliable stocks with The Monthly Dividend Paycheck Calendar, an easy-to-use system that shows you which dividend stocks to pick, when to buy them, when you get paid your dividends, and how much.  All you have to do is buy the stocks you like and tell them where to send your dividend payments. For more information Click Here.


Source: Investors Alley 

7 Dividend Stocks That May Be Hurting Your Retirement

Source: Shutterstock

Two key goals in retirement are to generate safe income and preserve capital. No one wants to outlive their nest egg.

Dividend-paying stocks are a popular asset class used to generate predictable, growing income. However, unlike the interest income paid by government-backed Treasury bonds, a common stock dividend can be far more discretionary in nature. When times get tough, a business will typically opt to reduce its dividend before jeopardizing its ability to meet its debt obligations, preserve its credit rating or invest in its long-term growth projects.

Unfortunately, a number of businesses are facing the tough decision to reduce their dividend at any one moment.

To alert investors of stocks that have the highest risk of reducing their current dividend in the future, Simply Safe Dividends created a Dividend Safety Score system that analyzes a company’s payout ratios, debt levels, recession performance, cash flow generation, recent earnings performance, dividend longevity and more.

Dividend Safety Scores are available for thousands of stocks, and scores range from 0 to 100. A score of 50 represents a borderline safe payout, but conservative investors are best off sticking with companies that score over 60 for Dividend Safety.

Investors can learn more about Dividend Safety Scores and view their real-time track record here(since inception they have flagged 99% of dividend cuts in advance).

I used Dividend Safety Scores to identify seven companies that have either recently cut their dividend and remain in trouble, or that could be facing a dividend cut in the near future. Owning companies like these can hurt a conservative retirement portfolio.

Dividend Stocks to Avoid: Frontier (FTR)

Dividend Stocks to Avoid: Frontier (FTR)

Source: Shutterstock

Dividend Yield: 0% (Dividend is currently suspended)

Dividend Safety Score: 1 (Very Unsafe)

Frontier Communications Corp (NASDAQ:FTR) finally bit the bullet and completely suspended its dividend in February 2018. The company had a Dividend Safety Score of 1, signaling a very unsafe payout, from Simply Safe Dividends before its cut announcement was made.

Frontier has reported a net loss the last two fiscal years and is saddled with debt, in part due to its poor decision to acquire some of Verizon’s fiber assets in 2016 for $10 billion.

The firm’s weak financial position has made it very challenging for it to make the investments in its communications networks that are necessary to remain competitive.

When combined with Frontier’s large debt load, sizable dividend and ongoing customer losses, management’s decision to eliminate the payout isn’t a big surprise.

Investors seeking high-yield replacement ideas can review analysis on our favorite high-dividend stocks here.

Dividend Stocks to Avoid: CenturyLink (CTL)

Dividend Stocks to Avoid: CenturyLink (CTL)

Source: Shutterstock

Dividend Yield: 12.7%

Dividend Safety Score: 3 (Very Unsafe)

CenturyLink Inc (NYSE:CTL) is one of the largest telecom services providers in America and sports a juicy yield north of 10%.

The company closed its $34 billion acquisition of international service provider Level 3 Communications in late 2017 to become more focused on serving businesses rather than consumers. The combined company has more than 10 million landline phone connections, over 5 million broadband internet subscribers, a few hundred thousand satellite TV subscribers, and a large focus on enterprise IT services.

CenturyLink is no stranger to dividend cuts, having reduced its payout in early 2013 (CTL’s stock tumbled more than 20% on the news). And another dividend cut could be in the cards, with Simply Safe Dividends assigning the company a very weak Dividend Safety Score of 3.

Legacy wireline phone services have been in decline for years as wireless phones continue replacing them. As a result, the company’s primary cash cow has been shrinking at a double-digit pace, causing its payout ratio to spike above 100% last year.

Investors are hoping the company’s Level 3 acquisition will successfully diversify CenturyLink’s cash flow away from declining legacy landlines and result in a more sustainable dividend profile.

Unfortunately, CenturyLink had to take on substantial debt to do this deal, and its sales and margins continued contracting last quarter.

Investors can learn more about CenturyLink’s Level 3 acquisition and how it impacts dividend safety here.

Overall, CenturyLink’s management team appears to have a very slim margin for error, and the dividend is on shaky ground. Conservative income investors are likely better off going elsewhere for reliable dividends and capital preservation.

Dividend Stocks to Avoid: Government Properties Income Trust (GOV)

Dividend Stocks to Avoid: Government Properties Income Trust (GOV)

Source: Shutterstock

Dividend Yield: 12.5%

Dividend Safety Score: 3 (Very Unsafe)

While Government Properties Income Trust (NASDAQ:GOV) has not raised its dividend over the last five years, income investors can’t complain about the stock’s generous 8% average dividend yield during this time.

GOV current yields more than 12%, but unlike recent years, the stock is increasingly looking like a yield trap. In fact, Simply Safe Dividends assigns the company an extremely low Dividend Safety Score of 3.

GOV is a real estate investment trust which owns over 100 properties leased primarily to the U.S. government and state governments.

Unfortunately, governments are looking to become much more efficient with their spending, including reducing the amount of office space per employee.

Analysts expect GOV’s adjusted funds from operations (AFFO) per share to slip more than 15% over the next 12 months, which will push the company’s AFFO payout ratio to nearly 130%.

When combined with the firm’s substantial amount of debt, a meaningful dividend cut could be on the horizon.

Dividend Stocks to Avoid: GlaxoSmithKline (GSK)

Dividend Stocks to Avoid: GlaxoSmithKline (GSK)

Source: Shutterstock

Dividend Yield: 6.8%

Dividend Safety Score: 30 (Unsafe)

GlaxoSmithKline Plc (ADR) (NYSE:GSK) has kept its dividend frozen since 2012 and has impressively paid uninterrupted dividends for nearly 20 consecutive years. When combined with its high yield and seemingly conservative payout ratio below 40%, it’s no wonder why the stock is popular with income investors.

However, the pharmaceutical giant is facing real growth struggles as branded and generic competition eats away at the pricing of its core drugs.

With pressure to continue expanding and its dividend consuming a meaningful amount of cash flow, it’s not out of the question that GlaxoSmithKline might opt to reduce its dividend to free up growth capital and keep its balance sheet in good shape.

GlaxoSmithKline has a Dividend Safety Score of 30 from Simply Safe Dividends, indicating that its payout is potentially unsafe and has a heightened risk of being cut in the future.

Income investors can learn more about GlaxoSmithKline and the safety of its dividend in the research note here.

Dividend Stocks to Avoid: Waddell & Reed (WDR)

Dividend Stocks to Avoid: Waddell & Reed (WDR)

Source: Shutterstock

Dividend Yield: 5.1%

Dividend Safety Score: 12 (Very Unsafe)

It’s no secret that the actively managed investment fund industry is under pressure. High fees, generally poor performance and an ever-growing number of low-cost passively managed funds are all factors putting pressure on companies like Waddell & Reed.

The company’s earnings have steadily declined since 2014, pushing its dividend payout ratio up to close to 90% last year. As a result, management ultimately decided to slash the firm’s quarterly dividend by 46%.

Simply Safe Dividends had assigned the company a Dividend Safety Score of 12 prior to its reduction announcement, signaling high risk of a payout cut.

Unfortunately the outlook remains somewhat grim for the business, largely driven by continued performance struggles and relatively high fees that averaged 66.5 basis points last quarter.

Less than 30% of Waddell & Reed’s fund assets were ranked in the top half of their group by Morningstar over the past three-year performance period. Not surprisingly, Waddell & Reed continues to see a couple billion dollars of asset outflows each quarter.

Should the market take a tumble, the business would come under further strain. Investors looking for a higher quality business in this industry can review our research on T. Rowe Price (TROW) here.

Dividend Stocks to Avoid: Dine Brands Global (DIN)

Dividend Stocks to Avoid: Dine Brands Global (DIN)

Source: Shutterstock

Dividend Yield: 3.6%

Dividend Safety Score: 4 (Very Unsafe)

Dine Brands Global Inc (NYSE:DIN) owns or franchises more than 1,900 Applebee’s and nearly 1,800 International House of Pancakes (IHOP) restaurants throughout the country.

The full-service casual dining industry has come under pressure in recent years. More consumers are opting for quick-service restaurants, which typically offer lower prices, better food quality and shorter waits to support an on-the-go lifestyle.

Dine Brands Global saw its adjusted earnings per share decline by more than 30% in fiscal 2017, driven largely by a 5.3% decline in Applebee’s comparable same-restaurant sales.

This pressure ultimately caused the company to lower its dividend by 35% in February 2018 to free up cash for brand investments and support its stretched balance sheet.

Simply Safe Dividends had issued the company a Dividend Safety Score of 4 prior to the dividend cut announcement, signaling that the firm’s payout was potentially very unsafe.

While the new dividend amount appears to be more sustainable for now, the business remains under press. The stock’s new yield sits close to 3.6%, which isn’t very competitive with other income options given the payout’s weak growth potential going forward.

Dividend Stocks to Avoid: Macquarie (MIC)

Dividend Stocks to Avoid: Macquarie (MIC)

Dividend Yield: 15.1%

Dividend Safety Score: 20 (Very Unsafe)

The market usually does not like surprise dividend cuts, and Macquarie Infrastructure Corp’s(NYSE:MIC) decision to reduce its payout by 31% in February 2018 was no exception.

MIC’s stock tumbled as much as 40% on the news and remains in the dumps. Not only do dividend cuts reduce retirement income, but they can permanently lose an investor’s hard-earned capital.

The infrastructure company’s management has historically run the business with a relatively high debt load and elevated payout ratio, reflecting the fairly predictable results its assets generated but retaining little cash with which to plow back into growth projects.

A new CEO started in late 2017 and decided to monetize several major assets at the company for a hefty profit. As a result, cash flow will fall and the dividend needed to be adjusted down with it for the rest of 2018.

A lower dividend also allows the company to fund more of its growth projects with internally generated cash flow rather than depend more on capital markets to raise funds.

Simply Safe Dividends had slapped the company with a “Very Unsafe” score of 20 prior to its surprising announcement.

Conservative investors can consider cutting their losses and moving on to other investment opportunities with safer, faster-growing income.

I can’t believe this “surfer dude” beat all those Wall Street legends... ​650 of the world’s biggest and brightest minds... I’m talking about legends like Mario Gabelli... David Einhorn... Joel Greenblatt... and Rick Rieder... who, combined, manage more than $5 trillion. All were forced to bow down to one “unheard of” trader from Laguna Beach. Click Here to discover the strategy he used while he had sand between his toes.

An Easy Trade to Make for Profits from Gold Price Volatility

There’s a lot to unpack when it comes to the current analysis of gold and precious metals. As you know, gold tends to be a safe-haven type of investment – something investors turn to when they don’t want their money associated with a certain company or government (bond/currency).

After the Financial Crisis of 2008-2009, gold became an extremely popular investment. For a few years there, it seemed like there was a gold-buying shop on every street corner. Gold was bid up, at least in part, by a massive amount of buying by central banks who wanted to back up their currencies with physical assets.

For the last several years though, gold and other precious metals have been trading at less elevated levels. Then again, with the February 5th meltdown, is it possible metals will become more valuable to investors?

Below is the chart of SPDR Gold Shares ETF (NYSE: GLD), one of the most popular ETFs out there and a very common method for investing in gold. You can see gold did spike during the market meltdown in early February, but has since come back down and is hanging out around the 50-day moving average.

Typically after periods of high volatility, investors start moving more of their portfolio to gold or other precious metals. Yet, in this case, gold lost its luster almost immediately after the market stabilized. Hence, while gold was still a quick buy during the crisis, it hasn’t been holding its own as a safety net after the fact.

Part of the reason could be the lack of any real fundamental concerns among investors. Inflation and tariffs (to some extent) are problems, but they take a long time to actually manifest as true issues. On the other hand, it could be that investors are using cryptocurrencies such as bitcoin as a store of value. After all, bitcoin is entirely decentralized.

So what’s that mean for gold? It’s certainly difficult to pick a clear direction for the precious metal, but it may be not be a stretch to suggest gold is going to move quite a bit from where it is – either up or down.

At least one size options trader believes this could be the case by June expiration. The trader purchased the June GLD 126 straddle (buying both the 126 call and 126 put in June) for $5.30 with the stock just below $126. The trade was executed nearly 2,500 times, so about $1.3 million in premium was paid.

In order to make money, GLD has to be higher than roughly $131 or below $121 by mid-June. Above or below those strikes, the position will generate $250,000 per dollar higher or lower. If GLD is at $126 at expiration, the trader loses the entire premium.

Given the uncertain future of gold as a safe-haven, I think this trade makes a lot of sense. However, I’d prefer to cut down the cost of the trade by doing a strangle instead. The only difference is you’re buying out-of-the-money calls and puts instead of at-the-money options in order to cut costs.

For example, buying the June 123 put and 129 call (the 123-129 strangle) only costs about $3.00. So you’re cutting your premium by almost half. Breakeven points become $120 and $132, do it does widen the targets a bit. Still, I think it’s a reasonable trade off to widen out the breakeven points by a $1 in order to cut almost $2.50 off the premium price. Ultimately, it reduces risk more than it reduces return potential – and that’s clearly a good thing.

  [FREE REPORT] Options Income Blueprint: 3 Proven Strategies to Earn More Cash Today Discover how to grab $577 to $2,175 every 7 days even if you have a small brokerage account or little experience... And it's as simple as using these 3 proven trading strategies for earning extra cash. They’re revealed in my new ebook, Options Income Blueprint: 3 Proven Strategies to Earn Extra Cash Today. You can get it right now absolutely FREE. Click here right now for your free copy and to start pulling in up to $2,175 in extra income every week.

Source: Investors Alley 

The 10 Best Stocks to Invest In Right Now

Source: Shutterstock

It’s a different market than it was just two months ago. Volatility has returned, even if it remains modest relative to historical levels. Big names like Procter & Gamble Co (NYSE:PG) and Walmart Inc (NYSE:WMT), among others, have seen precipitous share price declines just in the past few weeks.

It’s a choppier, more cautious, environment. That’s not a bad thing, however. After a basically uninterrupted post-election rally, several stocks have seen pullbacks that provide more attractive entry points. Others simply haven’t received their due credit from the market.

While there might be reasons for caution overall – higher interest rates, macro concerns – more opportunities exist as well.

This more and more looks like a “stockpicker’s market.” For those stockpickers, here are 10 stocks to buy that look particularly attractive at the moment.

10 Best Stocks to Invest In Right Now: Exxon Mobil

xom stock

Source: Shutterstock

I’m as surprised as anyone that Exxon Mobil Corporation (NYSE:XOM) makes this list. I’ve long been skeptical toward XOM. The internal hedge between upstream and downstream operations makes Exxon stock a surprisingly poor play on higher oil prices. Overall, it leads XOM to stay relatively rangebound – as it has been for basically a decade now.

But price matters, as I argued this week (insert link here if possible). And XOM is at its lowest levels in more than two years after a steady decline since late January. With the dividend over 4% and a sub-16x forward P/E multiple, Exxon Mobil stock looks like a value play. Meanwhile, management is forecasting that earnings can double by 2025, adding a modest growth component to the story.

Obviously, there’s a risk that Exxon management is being too optimistic. Years of underperformance relative to peers like Chevron Corporation (NYSE:CVX) and even BP plc (ADR) (NYSE:BP) has eroded the market’s confidence. If Tesla Inc (NASDAQ:TSLA) can lead a true electric car revolution, that, too, could impact demand and pricing going forward.

At current levels, however, the market is pricing in close to zero chance of Exxon hitting its targets. And that’s why XOM is attractive right now. A continuation of the status quo still gives investors 4%+ income annually. Any improvements in production, or pricing, provide upside. At a two-year low, Exxon doesn’t have to be perfect to see upside in XOM stock.

10 Best Stocks to Invest In Right Now: Nathan’s Famous

Nathan's Hot Dog Eating Contest 2017

Source: Flickr

In this market, recommending a restaurant owner – let alone a hot dog restaurant owner – might seem silly at best. But there’s a strong bull case for Nathan’s Famous, Inc. (NASDAQ:NATH) at the moment.

NATH, too, has seen a sharp pullback of late. The stock touched a 52-week (and all-time) high just shy of $95 in November. It’s since come down about 30%, though roughly one-sixth of the decline can be attributed to a $5 per share special dividend paid in December.

Yet the story hasn’t really changed all that much. Fiscal Q3 earnings in February were solid. The company’s agreement with John Morrell, who manufactures Nathan’s product for retail sale and Sam’s Club operations, offers huge margins, while revenue continues to grow. Foodservice sales similarly are increasing.

The restaurant business has been choppier. But it remains profitable. The mostly-franchised model there is similar to those of Domino’s Pizza, Inc. (NYSE:DPZ) and Yum! Brands, Inc.(NYSE:YUM), among others, all of whom are getting well above-market multiples.

All told, Nathan’s has an attractive licensing model, which leverages revenue growth across the operating businesses. And yet, at 13x EV/EBITDA, and 20x P/FCF, the stock trades at a significant discount to peers. NATH has stabilized over the past few weeks, and Q4 earnings in June could be a catalyst for upside. Investors would do well to buy NATH ahead of that report.

10 Best Stocks to Invest In Right Now: Bank of America

3 Reasons BAC Stock Has More Upside

Source: Shutterstock

Bank of America Corp (NYSE:BAC) trades at its highest level since the financial crisis, and has gained over 150% from July 2016 lows. Trading has been a bit choppier of late – no surprise for a macro-sensitive stock in this market — and there’s a case, perhaps, to wait for a better entry point.

But I’ve liked BAC stock for some time now, and as I wrote last week I don’t see any reason to back off yet. Earnings growth should be solid for the foreseeable future, given rising Fed rates and a strong economy.

BofA itself has executed nicely over the past few years. The company’s credit profile is solid and its stock has outperformed other big banks like Citigroup Inc (NYSE:C) and even JPMorgan Chase & Co. (NYSE:JPM). And tax reform and easing capital restrictions mean a big dividend hike could be on the way as well.

And despite the big run, it’s not as if BAC is expensive. The stock still trades at less than 12x 2019 EPS estimates. Unless the economy turns south quickly, that seems too cheap. So it looks like the big run in Bank of America stock isn’t over yet.

10 Best Stocks to Invest In Right Now: Nutrisystem

Source: Nutrisystem

Nutrisystem Inc. (NASDAQ:NTRI) is another candidate to buy on a pullback. In a disappointing Q4 earnings release at the end of February, Nutrisystem disclosed a rough start to 2018. The beginning of the year is known as “diet season”, a key period for companies like Nutrisystem and  Weight Watchers International, Inc. (NYSE:WTW), as many customers look to act on New Year’s Resolutions.

But marketing missteps led to poor results from Nutrisystem. 2018 guidance now implies basically zero revenue growth – after analysts had projected a 13% increase for the full year.

Still, Nutrisystem is now priced almost as if growth is coming to an end for good. And I as argued at the time, that’s just too pessimistic. The average Street target price still is well above $40, implying over 30% upside. NTRI now trades at under 16x the midpoint of 2018 EPS guidance, and yields over 3%.

The valuation implies that Nutrisystem management is wrong – that 2018’s deceleration is a permanent change. If Nutrisystem management is right – and they’ve earned some credibility in leading revenue and profit to soar over the past few years – then $32 is a far too cheap price for NTRI.

10 Best Stocks to Invest In Right Now: Roku

Why There's a Lot of Volatility Coming for ROKU Stock

Source: Shutterstock

Roku Inc (NASDAQ:ROKU) undoubtedly is the riskiest stock on this list. And there certainly is a case for caution. The company remains unprofitable on even an Adjusted EBITDA basis. A ~7x EV/revenue multiple isn’t cheap; it’s even higher considering that almost half of 2018 revenue will come from the player business, which is a ‘loss leader’ for advertising and platform revenue.

But management also detailed a really interesting future on the Q4 call. The company is looking to build a true content ecosystem – and from a subscriber standpoint, already has surpassed Charter Communications Inc (NASDAQ:CHTR) and trails only AT&T Inc. (NYSE:T) and Comcast Corporation (NASDAQ:CMCSA).

Again, this is a high-risk play – but it’s also a high-reward opportunity. Margins in the platform segment are very attractive, and should allow Roku to turn profitable relatively quickly. International markets remain largely untapped. There’s a case for waiting for a better entry point, or selling puts. But I like ROKU at these levels for the growth/high-risk portion of an investor’s portfolio.

10 Best Stocks to Invest In Right Now: Brunswick

Source: Shutterstock

Brunswick Corporation (NYSE:BC) is due for a breakout. The boat, engine, and fitness equipment manufacturer is nearing resistance around $63 that’s held for close to a year now. Despite a boating sector that has roared of late, BC – the industry leader – has been mostly left out.

Over the last year, smaller manufacturers Marine Products Corp. (NYSE:MPX), Malibu Boats Inc (NASDAQ:MBUU), and MCBC Holdings Inc (NASDAQ:MCFT) have gained 51%, 71%, and 68%, respectively. BC, in contrast, has gained just 2%. It actually trades at a discount to MBUU and MCFT – despite its leadership position and strong earnings growth of late.

Efforts to build out a fitness business have had mixed results, and may support some of the market’s skepticism toward the stock. But Brunswick now is spinning that business off, returning to be a boating pure-play.

Cyclical risk is worth noting, and there are questions as to whether millennials will have the same fervor for boating as their parents. But at 12x EPS, with earnings still growing double-digits, BC is easily worth those risks.

And if the stock finally can break through resistance, a breakout toward $70+ seems likely.

10 Best Stocks to Invest In Right Now: Pfizer

3 Reasons to Be Bullish on PFE Stock

Source: Shutterstock

Few investors like the pharmaceutical space at this point – or even healthcare as a whole. But amidst that negativity, Pfizer Inc. (NYSE:PFE) looks forgotten.

This still is the most valuable drug manufacturer in the world (for now; it’s neck and neck with Novartis AG (ADR) (NYSE:NVS)). It trades at just 12x EPS, a multiple that suggests profits will stay basically flat in perpetuity. To top it off, PFE offers a 3.7% dividend yield.

Obviously, there are risks here. Drug pricing continues to be subject to political scrutiny (though the spotlight seems to have dimmed of late). Revenue growth has flattened out of late. But Pfizer still is growing earnings, with adjusted EPS rising 11% last year and guidance suggesting a similar increase this year. Tom Taulli last month cited three reasons to buy Pfizer stock – and I think he’s got it about right.

10 Best Stocks to Invest In Right Now: Valmont Industries

Source: Shutterstocks

Valmont Industries, Inc. (NYSE:VMI) offers a diversified portfolio – and across the board, business has been relatively weak of late. The irrigation business has been hit by years of declining farm income. Support structures manufactured for utilities and highways have seen choppy demand due to uneven government spending. Mining weakness has had an impact on Valmont’s smaller businesses as well.

Valmont is a cyclical business where the cycles simply haven’t been much in the company’s favor. Yet that should start to change. 5G and increasing wireless usage should help the company’s business with cellular phone companies. Irrigation demand almost has to return at some point. And a possible infrastructure plan from the Trump Administration would benefit Valmont as well.

Concerns about the recently imposed tariffs on steel likely have hit VMI, and sent it back to support below $150. But many of Valmont’s contracts are ‘pass-through’, which limits the direct impact of those higher costs on the company itself. Despite uneven demand, EPS has been growing steadily, and should do so in 2018 as well.

And yet VMI trades at an attractive 16x multiple – a multiple that suggests Valmont is closer to the top of the cycle than the bottom. That seems unlikely to be the case, and as earnings grow and the multiple expands, VMI has a clear path to upside.

10 Best Stocks to Invest In Right Now: American Eagle Outfitters

Is It Worth Chasing the Rally in AEO Stock?

American Eagle Outfitters (NYSE:AEO) is one of the, if not the, best stocks in retail – and that’s kind of the problem. Mall retailing, in particular, has been a very tough space over the past few years. And it’s not just the impact of Amazon.com, Inc. (NASDAQ:AMZN) and other online retailers. Traffic continues to decline, which pressures sales and has led to intense competition on price, hurting margins.

But American Eagle has survived rather well so far, keeping comps positive and earnings stable. And yet this stock, too, trades at around 12x EPS, backing out its net cash. And American Eagle has an ace in the hole: its aerie line, which continues to grow at a breakneck pace. aerie brand comparable sales rose 27% in fiscal 2017, on top of a 23% rise the year before.

The company’s bralettes and other products clearly are taking share from L Brands Inc(NYSE:LB) unit Victoria’s Secret. And the e-commerce growth in that business, and for American Eagle as a whole, suggests an ability to dodge the intense pressure on mall-based retailers.

In short, American Eagle isn’t going anywhere. There’s enough here to suggest American Eagle can eke out some growth, and a 2.5% dividend provides income in the meantime.

The stock already is recovering from a post-earnings sell-off last week, and should continue to do so. And longer-term, there’s still room for consistent growth, and more upside.

10 Best Stocks to Invest In Right Now: United Parcel Service

Source: UPS

United Parcel Service, Inc. (NYSE:UPS) fell when the broad market did in February – and simply never recovered. A disappointing Q4 earnings report, in which investors saw signs of higher spending, drove some of the decline. But UPS stock wound up falling 22% in a matter of weeks – which looks like an unjustified sell-off.

UPS is going to have to spend to add capacity, and in this space too there’s the ever-present threat of Amazon. But UPS is an entrenched leader, along with rival FedEx Corporation(NYSE:FDX), and it at worst can co-exist with Amazon. E-commerce growth overall should continue to increase demand; there’s enough room for multiple players in the global market.

Meanwhile, the sell-off and benefits from tax reform mean that UPS now is trading at just 15x the midpoint of its guidance for 2018. And the stock yields a healthy 3.3%. Investors clearly see a risk that growth will decelerate, but UPS stock is priced as if that deceleration is guaranteed.

  [FREE REPORT] Options Income Blueprint: 3 Proven Strategies to Earn More Cash Today Discover how to grab $577 to $2,175 every 7 days even if you have a small brokerage account or little experience... And it's as simple as using these 3 proven trading strategies for earning extra cash. They’re revealed in my new ebook, Options Income Blueprint: 3 Proven Strategies to Earn Extra Cash Today. You can get it right now absolutely FREE. Click here right now for your free copy and to start pulling in up to $2,175 in extra income every week.

Trump’s Trade War Set to Cost This Automaker $1 Billion: Sell Now

If you like a good war, you’re living in the right era.

You don’t have to look far before you hear about a war on something.

War on crime. War on drugs. And outright war itself.

Now we’re facing another one.

News that the United States will slap a 25% tariff on steel imports and 10% on aluminum imports has triggered fears of a global trade war.

European Commission President Jean-Claude Juncker set the tone by saying that the EU will be forced to retaliate to the “stupid process” by imposing tariffs of its own on exported U.S. goods. “We can also do stupid. We have to be this stupid,” as he put it.

Adding duty to such crucial raw materials from abroad should bode well for U.S. steel and aluminum manufacturers – and their respective workforces. But it will also reduce global supplies and consequently push up prices for end users. In turn, those costs will be passed down to consumers.

When you think of the amount of steel and aluminum used in products, many sectors and industries will suffer. Chief among them are ones like construction and transportation.

Indeed, the auto industry accounted for over one-quarter of U.S. steel demand last year, according to Statista. And the American International Automobile Dealers Association has already said the tariffs will result in higher car prices and lower sales.

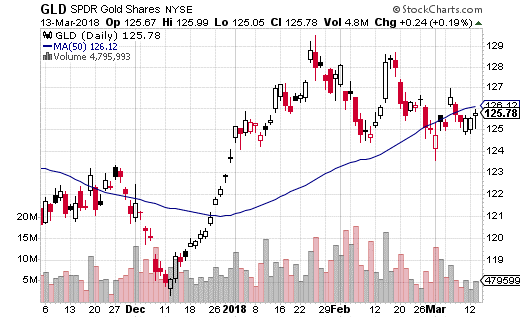
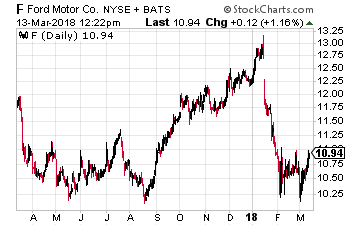
That’s bad news for big, multinational U.S. automakers like Ford Motor Co. (NYSE: F).

Speed Bumps Ahead for Ford

Right off the bat, the stock is down 11.3% year-to-date. But the losses extend further back than that. Since July 2014, shares have tumbled steadily, falling 39%.

Other recent developments don’t bode well, either.

Sales Down: Nationwide, total auto sales fell by 2% in 2017. And while overall year-over-year sales were up 1% in January, Ford didn’t join the party, with sales down 6.6%. The climate got worse in February, with total nationwide sales dropping by 2% and Ford’s sales slumping by 6.8%. A 12.3% plunge in higher-end SUV sales marked the fall. Some analysts feel auto sales peaked in 2017. The fact that Ford’s shares still didn’t rise as a result back then – and its sales are now lagging significantly – is an ominous sign.

Interest Up: Another red flag is the fact that the price of a new car rose by 2% in February, to $35,444, according to Kelley Blue Book. Not only that, interest rates on car payments (both new purchases and leases) are rising, too. Edmunds says the APR averaged 5.2% in February – up from 4.9% a year ago and from 4.4% in February 2013. They’re now at the highest levels since 2010. Rising car prices and interest rates aren’t exactly a good combination for automobile manufacturers trying to boost sales numbers.

As if this climate weren’t challenging enough, Ford and other conventional automakers are also facing pressure from the increasing shift towards ride-sharing and electric cars.

And now, in addition to these headwinds, is the specter of trade tariffs. UBS says higher raw materials prices could cost Ford an extra $300 million this year, with Goldman Sachs warning it could hit the company’s operating profit by $1 billion. Keep in mind, Ford’s operating margin isn’t great anyway – just 4.3%.

Add it all up, and you’ve got a nasty cocktail for Ford: Falling auto sales, higher sales prices, rising interest rates on car payments that’s deterring consumers from new purchases, the shift towards ride-sharing and electric cars, plus steel and aluminum tariffs adding to retail prices.

Oh, and a stock that’s gone nowhere but down for almost four years now.

Give Ford a wide berth.

Buffett just went all-in on THIS new asset. Will you?
Buffett could see this new asset run 2,524% in 2018. And he's not the only one... Mark Cuban says "it's the most exciting thing I've ever seen." Mark Zuckerberg threw down $19 billion to get a piece... Bill Gates wagered $26 billion trying to control it...
What is it?
It's not gold, crypto or any mainstream investment. But these mega-billionaires have bet the farm it's about to be the most valuable asset on Earth. Wall Street and the financial media have no clue what's about to happen...And if you act fast, you could earn as much as 2,524% before the year is up.
Click here to find out what it is.

Source: Investors Alley

This Math Is Magic


Dear Early Investor,

Last week, I told you about how adding a technical analysis layer to my stock vetting made me a much better investor.

This week, I’m going to share with you how I do it.

Of course, I can’t tell you everything in one short article. My partner Adam has already discussed a neat technical analysis tool called the relative strength index. Read his piece here if you haven’t already. It’s definitely worth a few minutes of your time.

Today, I’ll be discussing another neat tool: Fibonacci retracements.

It’s not the only tool I use. In fact, Fibonacci is most effective when used with other technical indicators. But it’s definitely one I like a lot.

For one, it’s versatile. It can help predict the extent of both pullbacks and rallies.

So what exactly are Fibonacci retracements?

They’re ratios that indicate when price reversals may be drawing near.

What this means is when a price line hits these levels, it signals a possible turnaround. When other technical indicators also point to a turnaround at the same time, the signal is amplified.

The most common Fibonacci ratios are 23.6%, 38.2% and 61.8%. (You’ll also see a 50% level with most Fibonacci charts – though technically, it’s not a part of the Fibonacci sequence.)

Curious as to where these ratios come from?

Well, we have to go back nearly a thousand years to identify their origins.

Leonardo Pisano Bigollo (aka Fibonacci) was a mathematician from Pisa who introduced the Fibonacci sequence to the West in the 12th century. It is as follows: 0, 1, 1, 2, 3, 5, 8, 13, 21, 34, 55, 89, 144, 233, 377, 610… and so on to infinity.

Fibonacci demonstrated how a number divided by the previous number in his sequence approximates 1.618. And, lo and behold, a number divided by the next highest number approximates 0.6180.

It’s known as the “golden ratio,” and it is the ratio I consider the most important. (By the way, the inverse of 1.618 is approximately 0.618!)

What I find fascinating is that these ratios are also found throughout nature, architecture, art and biology. They can be seen in everything from sunflowers to the spirals in galaxies.

The next most significant number? It’s 0.3820.

It’s the number you get when you take one of Fibonacci’s sequence numbers and divide it by another one two places higher. For example: 13/34 = .382. (Also note that 1 – .618 = .382.)

Years ago, I used these ratios for stock price analysis. Now I’m back at it, using them to help predict crypto price movements. It’s like meeting an old friend!

They’re called retracement levels (or ratios) because they refer to price movements that retrace in the opposite direction of a previous leg up or down.

As the bounce or correction approaches these retracement levels, technical analysts become increasingly aware of a possible price reversal, especially when other indicators are chiming in.

To illustrate just how Fibonacci works, I’m going to show you three bitcoin charts. For purposes of clarity, I’m not including other technical indicators, so keep in mind these charts have been simplified to an extent.

After a long climb, bitcoin finally peaked last December and began retracing some of the gains it previously made.

But by how much?

Remember, I said that 61.8% was the level I paid most attention to. You’ll notice in the chart that once prices broke below that important level, they immediately began a new leg up.

What can you do with this information?

When others may be thinking of selling, you’re thinking of buying on the dip. At the very least, it prevents you from selling at the wrong time.

Here’s another bitcoin chart using the Fibonacci levels from earlier, identifying a smaller leg up from last September…

As prices approach the 61.8% level, the possibility of a price reversal once again presents itself.

And another buying opportunity is indicated in advance using the Fibonacci levels.

So what about right now?

What can the Fibonacci levels tell us about current price movements?

With prices just shy of the 61.8% level, they say that a rally could be imminent.

A couple of things to remember here…

While Fibonacci puts me on the alert for a price reversal, I like to see it actually happening before issuing a buy or sell alert. And, as I’ve said, I like to see other indicators supporting what Fibonacci is telling me.

As I mentioned last week, we’re dealing in probabilities here, not certainties. So even though I now have a technical system in place (I call it the “Cadillac of technical analysis systems”) telling me how much lower prices need to go for an upswing to occur, there are no guarantees.

Nonetheless, these kinds of technical analysis tools go a long way in helping me understand price trends and manage risk.

We’now better equipped to give our members insightful buy and sell guidance so they can optimize gains, minimize losses and, at the end of the day, show greater overall crypto profits.

Soon, in our Crypto Asset Strategies service, we’ll focus much more on using technical analysis like this to help us vet new crypto recommendations. If this kind of approach interests you, be sure to keep a close eye on our upcoming alerts.

Good investing,

Andy Gordon
Co-Founder, Early Investing

The 145 Companies Your Stockbroker Will NEVER Tell You About Did you know more than 145 tiny companies have grown to $1 billion-plus valuations since 2012? SpaceX  is up 26,309% in value... Dropbox 31,733%... and Pinterest 487,404%. All of these 145 businesses started out as private companies your broker would have NEVER told you about. But now there’s a great way to find the next private companies poised for hyper-growth. Full Details Here.

Source: Early Investing 

5 ‘Strong Buy’ Biotechs That Can Double in 2018

Source: Shutterstock

According to top analysts on the Street, these five “Strong Buy” biotech stocks are primed for outsized growth in the next 12 months.

Biotechs often present intriguing, and potentially lucrative, investment opportunities. Share prices can explode on positive trial results or key regulatory approvals. However, buyers beware: These rewards can disappear just as quickly if critical data disappoints. To minimize this risk, we specifically searched for stocks with a high degree of confidence from Wall Street’s top analysts.

In this case, we used the popular Trending Stocks tool to filter for best-rated stocks in the last week, regardless of market capitalization. The best part about this tool is that it clearly displays the upside potential from the current share price to the average analyst price target.

So we crunched the data and pinpointed these five compelling biotech stocks that are trending right now. All five stocks share a bullish Strong Buy analyst consensus rating. Note that this is based only on analyst ratings from the last three months.

With this in mind, let’s delve deeper into why the Street is so bullish on these stocks right now:

Strong Buy Biotech: TG Therapeutics (TGTX)

Strong Buy Biotech: TherapeuticsMD (TXMD)

Source: Shutterstock

TG Therapeutics, Inc. (NASDAQ:TGTX) is focused on the development of novel treatments for B-cell malignancies and autoimmune diseases. Following strong Q4 results, five-star HC Wainwright analyst Edward White ramped up his price target from $33 to $38 (130% upside potential) on March 8.

His reasoning for the valuation is a bit complex, but ultimately it is based on the success and potential revenue of the company’s two main drugs ublituximab and umbralisib. Both are currently in Phase 3 clinical development. White explains: “We use the net present value of our revenue forecast through 2026, apply a 55% probability of success (POS) for ublituximab in CLL (Chronic Lymphocytic Leukemia), a 45% POS for umbralisib in CLL, and a 25% POS for both ublituximab and umbralisib in NHL (Non-Hodgkin Lymphoma), to arrive at our $38 price target.”

Bear in mind that so far White has struck gold with his TGTX recommendations. Across his 20 ratings on the stock he scored a 90% success rate and 44.4% average return. Meanwhile B.Riley FBR’s Madhu Kumar selects TGTX as an Out the Gate 2018 Pick, due to his “reasonable confidence in success in the Phase III UNITY-CLL trial, with interim data expected in 2Q18.”

In the last three months, four analysts have published buy ratings on TGTX. No hold or sell ratings here. And with an average analyst price target of $27.50, on average analysts are predicting 67% upside from the current share price.

Strong Buy Biotech: TherapeuticsMD (TXMD)

Strong Buy Biotech: TherapeuticsMD (TXMD)

Source: Shutterstock

Innovative women’s healthcare company, TherapeuticsMD, Inc. (NYSE:TXMD), is launching important therapies for menopause-associated conditions. The company has just scored a big regulatory win. On March 8, the FDA announced that it is accepting an NDA (new drug application) for TX-001HR without noting any ‘potential review issues.’ Now the key date to keep an eye on is Oct. 28, 2018, when the FDA will either approve or reject the application.

“We view the revenue opportunity for TX-001 (hot flushes of menopause) to be several times larger than that for TX-004 and believe prevailing compounding regulations and compounder willingness to prescribe branded drugs could benefit TXMD” states top Cantor Fitzgerald analyst William Tanner. He sees the stock spiking a whopping 400% to hit $28 from the current share price of just $5.50.

In the meantime, TXMD’s other pipeline product, TX-004, has its approval date on May 29. This is a critical barometer for the success of TX-001 according to Tanner. He says: “we view the importance of the FDA’s action around that date to be of Brobdingnagian proportion.” This is because any response short of approval will lead to stock selling.

Bear in mind, the stock has unanimous support from the Street. In the last three months five analysts have published buy ratings on TXMD. Their average price target of $15.50 works out at 190% upside from the current share price of just $5.35. 

Strong Buy Biotech: Clearside Biomedical (CLSD)

Strong Buy Biotech: Clearside Biomedical (CLSD)

Source: Shutterstock

Clearside Biomedical, Inc. (NASDAQ:CLSD) develops first-in-class drug therapies to treat blinding eye diseases. The stock is already up by a massive 80% year-to-date. Shares surged from just above $6 at the end of February to over $14 at the beginning of March. The catalyst: positive results in a late-stage trial to improve vision in patients with back of the eye swelling – otherwise known as macular edema.

The company revealed that 47% of patients administered the suprachoroidal CLS-TA treatment, could see at least 15 letters, compared to just 16% for patients with the placebo. CLSD now plans to file a marketing application with the FDA in Q4.

But don’t worry it’s not too late to profit from the stock’s meteoric rise. Top Wedbush analyst Liana Moussatos has just ramped up her price target to $29 on the news. This indicates further upside potential of 137%. She believes the results further validate CLSD’s micro-injection technology.

Moussatos commented, “In addition to several positive Phase 2 trials in ME-NIU, ME-RVO and DME, the PEACHTREE trial results represent the first clinical success at the Phase 3 level. Vision gain from suprachoroidal CLS-TA was observed as early as 30 days and maintained throughout the 6-month study. Due to the strength of the Phase 3 results, we consider clinical risk for the pipeline to be reduced.”

Overall, CLSD boasts six back-to-back buy ratings. Analysts (on average) see the stock soaring 80% to hit $22.80 in the coming months.

Strong Buy Biotech: Ocular Therapeutix (OCUL)

Strong Buy Biotech: Ocular Therapeutix (OCUL)

Source: Shutterstock

Why have one eye drug company when you can have two?! Ocular Therapeutix, Inc.(NASDAQ:OCUL) has a clear goal: to pioneer a new era of drug delivery in ophthalmology. OCUL is currently trading at a bargain price of just $6.37. However, analysts are projecting big upside potential of 115% in the coming months. The company has received three buy ratings in the last three months.

Right now, OCUL has 1 approved product (ReSure Sealant for cataract incision closure) and 6 pipeline products. The big hitter here is Dextenza for the treatment of post-surgery eye pain and inflammation. Although the FDA rejected the drug’s first new drug application (NDA), everything is now on track for resubmission in the first half of 2018. The company has worked closely with the FDA to resolve all the issues. Luckily for OCUL, the FDA’s comments have not required any substantial change in its manufacturing or regulatory plans.

On this basis, five-star BTIG analyst Dane Leone sees Dextenza obtaining US regulatory approval by the end of 2018. The upshot is potential market entry for the drug as early as 2019. And from a financial perspective, the company raised $37 million additional capital in January, which provides a cash runway well into 2019.

Strong Buy Biotech: Flex Pharma (FLKS)

Strong Buy Biotech: Flex Pharma (FLKS)

Source: Shutterstock

Last but not least comes ‘Strong Buy’ stock Flex Pharma, Inc. (NASDAQ:FLKS). Flex develops treatments for cramps and spasms associated with severe neurological diseases including ALS, MS and CMT (Charcot–Marie–Tooth disease).

Top HC Wainwright analyst Andrew Fein has just reiterated his Flex buy-rating with a very bullish $40 price target. Given that the stock is currently trading at just $5, this indicates huge upside potential of over 680%. He is confident in the ‘mechanistic rational’ of the company’s spasm reduction FLX-787 therapy.

“Catalysts on deck in MS, ALS, and CMT may provide near-term inflection points” according to Fein. Prepare for the read-out data from FLX-787’s exploratory Phase 2 spasticity study in multiple sclerosis to hit later this month. Later down the line, in early 2019, investors are looking to results from two Phase 2 trials in patients with ALS and CMT.

“All these activities in the pipeline may provide near-term inflection points, and signal to us that the company is making solid strides, and is committed, to transitioning into a pharmaceutical company from a consumer company” cheered Fein on March 8.

Flex boasts four recent buy ratings with just 1 analyst sticking to the sidelines. The $17.50 average analyst price target is over 200% from the current share price.

Buffett just went all-in on THIS new asset. Will you?
Buffett could see this new asset run 2,524% in 2018. And he's not the only one... Mark Cuban says "it's the most exciting thing I've ever seen." Mark Zuckerberg threw down $19 billion to get a piece... Bill Gates wagered $26 billion trying to control it...
What is it?
It's not gold, crypto or any mainstream investment. But these mega-billionaires have bet the farm it's about to be the most valuable asset on Earth. Wall Street and the financial media have no clue what's about to happen...And if you act fast, you could earn as much as 2,524% before the year is up.
Click here to find out what it is.

ETF Traders Are Giving You These 3 High-Yield Stocks at a Discount

For investors who own individual dividend paying stock, it has become difficult to see why share prices move as they do. You probably know the feeling of having one of your stocks make a big move —usually down—and you cannot see any reason for the stock price action. Much of the blame for wild stock swings can be laid at the feet of exchange traded funds and the traders who short-term trade ETFs.

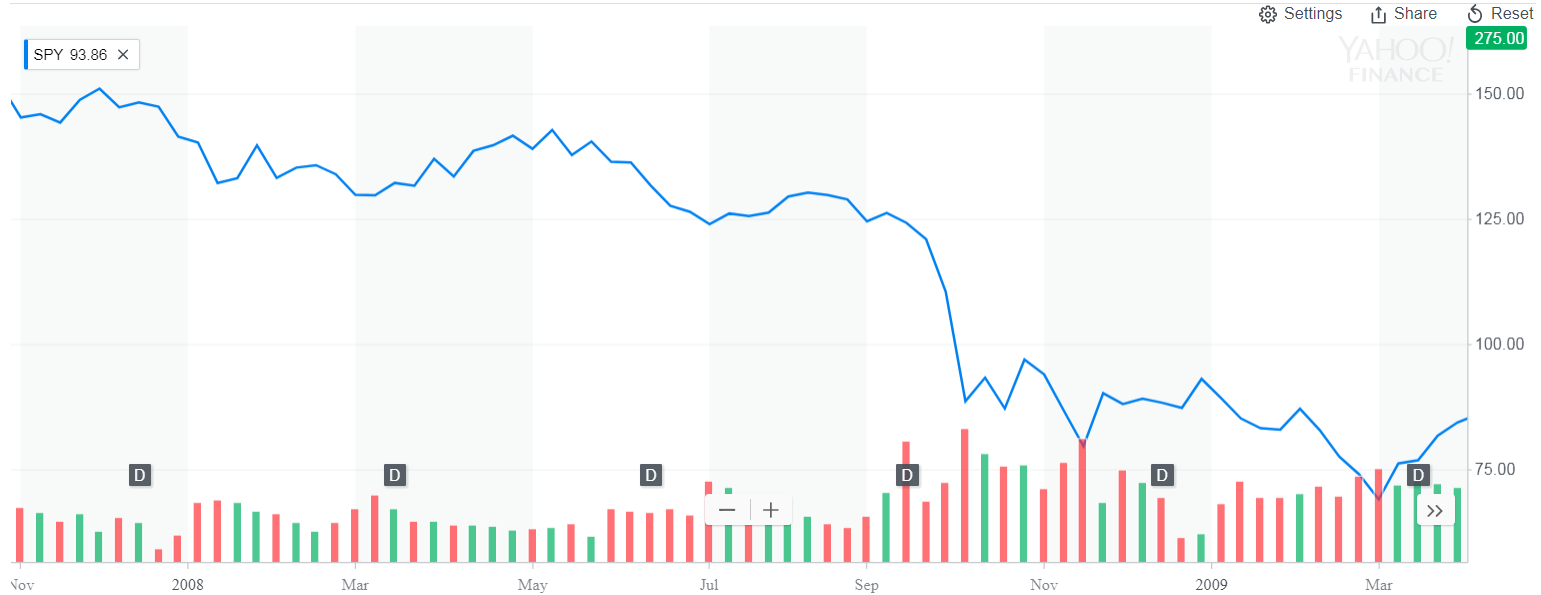
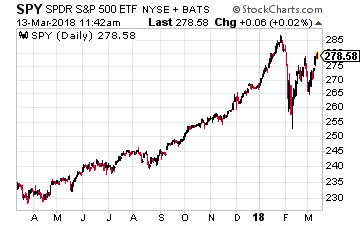
An ETF owns shares of stock to match the components of a specific stock index. For example, the SPDR S&P 500 ETF (NYSE: SPY) owns the 500 stocks in the same proportion as tracked by the Standard & Poor’s 500 stock index. The financial products industry has gone nuts with the development of new indexes to carve up the market into sectors and ETFs to track them. Currently there are over 2,000 ETFs listed in the U.S. The majority —78% of assets—of ETFs are based on stock market indexes. Those assets total over $2.4 trillion. ETF trading has become a very big part of what goes on in the stock markets.

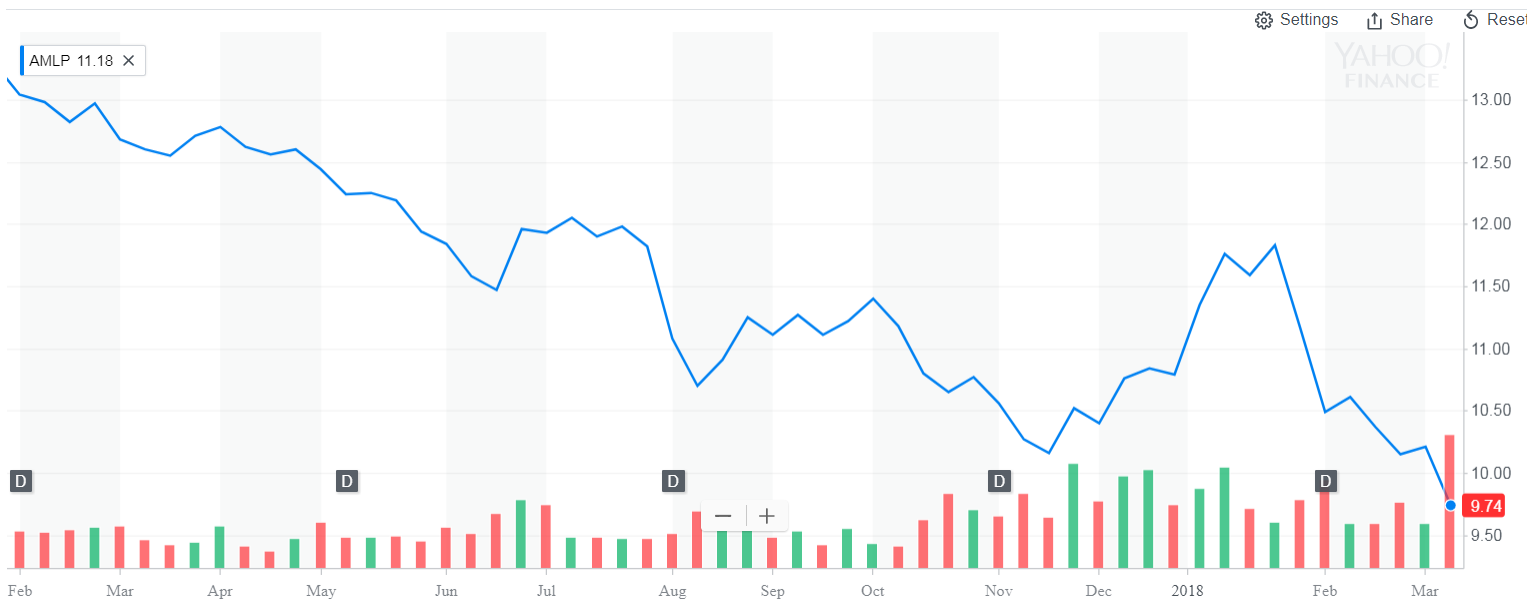
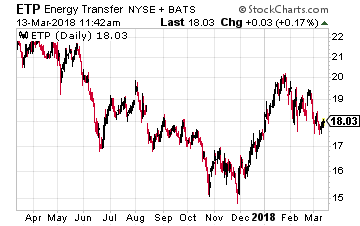
There are two ways ETF action can affect the share values of individual stocks. The most obvious and easy to discern is when the weighting of a stock in an index is changed. One high yield example is Energy Transfer Partners LP (NYSE: ETP), a large cap master limited partnership, commonly abbreviated as MLP. In April 2017 ETP completed a merger with Sunoco Logistics Partners LP, another MLP that was a large component of MLP indexes. Because of the merger, ETFs and index funds tracking MLP indexes were forced to sell significant portions of their ETP holdings to bring the size of the positions down to match the index weightings. This merger was the start of a year long decline in the ETP unit value. Later in 2017, Alerian, the provider of the most popular MLP tracking indexes, changed its methodology to cap Alerian MLP Index constituents to a 10% weight. At that time, ETP’s weight was much higher than 10% in the index, so index tracking funds were again forced to sell ETP units, regardless of investment merit. These forced sales of ETP are the source of much of the 25% value decline over the past year. The company’s fundamentals have been steadily improving, but you could not tell by the market price. ETP currently yields 12.5%.

Related: 3 Growth ETFs for High Yield and Diversification

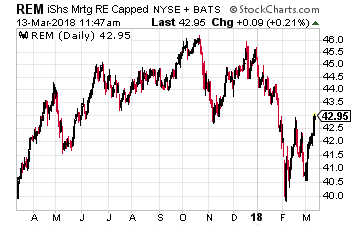
A subtler effect of the ETF boom is that trading of these funds leads to lack of discrimination between the financial results and business prospects. Stocks get lumped together into the ETFs that track specific market sectors. It is tough to figure out whether stock share prices and ETF trading are a chicken and egg dilemma, but it is becoming clearer that increases in ETF trading are tightening correlations, or the tendency for individual stocks and sectors to move up or down in lock step, regardless of a company’s fundamentals. While ETFs account for about 8% of the U.S. stock market value, ETFs are the source of more than 25% of the trading volume. Market observation clearly shows that share prices are greatly affected by short term sector switching by traders. The iShares Mortgage Real Estate ETF (NYSE: REM) provides a couple of examples. Most of the 30 or so stocks in this ETF own leveraged portfolios of residential mortgage backed securities, MBS in industry parlance. This business model is a dangerous game of lending long and borrowing short. This is a group of companies whose finances can be destroyed by a quick change in the yield curve. I recommend against owning any residential MBS focused REITs.

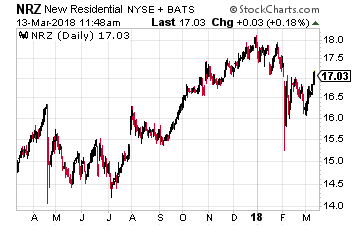
In contrast, the third and fourth heavily weighted stocks in REM are solid companies with business operations that are sustainable through market cycles. In contrast to the rest of the REM portfolio stocks, these two will do even better when short term rates rise. Starwood Property Trust, Inc. (NYSE: STWD) and New Residential Investment Corp (NYSE: NRZ) are very attractive stocks with share prices that have trouble escaping from the trading in REM. STWD currently yields 9% and NRZ is over 11%.

Get up to 14 dividend paychecks per month from safe, reliable stocks with The Monthly Dividend Paycheck Calendar, an easy-to-use system that shows you which dividend stocks to pick, when to buy them, when you get paid your dividends, and how much.  All you have to do is buy the stocks you like and tell them where to send your dividend payments. For more information Click Here.


Source: Investors Alley 

3 Funds Paying Up to 12% and Set to Rip Higher

The big rebound is on! But don’t worry, your opportunity to grab big gains (and dividends) hasn’t evaporated.

There’s still time!

And you can start with 3 of the 4 funds I pounded the table on back on February 19. At the time, all 4 of these cheap selloff buys were paying a combined 13.4% income stream.

So why are just 3 of these funds still worthy of your attention, only a few weeks later?

I’ll unpack that—and name these 3 top-flight funds—in a moment. First, let’s step back and take a look at what happened in a very wild February, and where it all leaves us now.

A Market Disaster Gets Undone

So much has happened. First, the S&P 500 (SPY) did this:

Was It All a Dream?

The good news is, the stock market losses we saw at the start of the month are now history.

The even better news is that the S&P 500 is up just over 3% from the start of 2018, meaning this market isn’t overheated. That “goldilocks” position should be giving investors more confidence that now is the right time to get back into the game.

It also means time is running out if you haven’t gotten back in already.

And if you’re sitting on cash?

No problem. I’ll show you where to put that cash to work without overpaying too much for the wrong investments.

But before I get to that, let’s take a look at those 4 funds I earmarked in February. They were the PCM Fund (PCM), the Virtus Global Multi-Sector Income Fund (VGI), the Kayne Anderson MLP Investment Company (KYN) and the Dreyfus Strategic Municipal Bond Fund (DSM).

How do these funds look now?

A Quick Improvement

While the warm weather—and a corresponding drop in natural gas and heating oil demand—has weighed on the master limited partnership–focused Kayne Anderson fund, the average return for these picks since I pointed them out, about two weeks ago, is 2.7%, while the S&P 500 is down slightly since then.

In other words, if you’ve heard that buying a low-fee index fund is the right thing to do, just take a look at that chart.

So What Now?

To determine which of these funds remain compelling options, we need to look at their discount to net asset value.

This is where we compare the market price for these funds, which trade daily like normal stocks, and their NAV, which is based on the market price of every item in their portfolios.

Now you’d think an efficient market would make these two figures the same, right? Wrong!

That’s because these are closed-end funds, a little-known corner of the market that’s worth around $300 billion, compared to the multi-trillion-dollar mutual fund and ETF universes. (If you’re unfamiliar with CEFs, click here for an easy-to-follow primer I recently wrote on these cash machines.)

The small size of the CEF market means a lot of big investors who could profit from these inefficiencies don’t bother—and it also means a lot of mom-and-pop investors don’t know these funds even exist.

That’s our opportunity.

The 4 funds I’ve shown you are all CEFs, and, of course, none of them are trading at their NAV (although two do come close):

3 Bargains—and 1 Ship That’s Sailed

First, let’s tackle the PCM Fund, which trades at a 9.8% premium to its NAV, meaning it’s priced above the actual market value of its portfolio. That’s because PIMCO, the fund manager, is great at beating the market, so the market rewards them with a premium.

But a near double-digit premium is too rich for my blood, so this isn’t the best fund to buy right now. And if you nabbed PCM at its unusually low premium earlier in February, you might want to consider getting out or, at the very least, holding on and allocating cash to other investments.

Meanwhile, the Dreyfus Strategic Municipal Bond Fund sports a discount to NAV that has widened since my February 19 article—but investors haven’t really lost any money since I recommended it. How is that possible?

Simple: the fund’s price has slid, but the NAV is staying straight.

Stable NAV, Lower Price

And since investors are still getting the fund’s 5.5% dividend yield, they’re pocketing a strong income stream while they hold on. And since it’s gotten even cheaper, despite the fact that the fund’s real, intrinsic value hasn’t changed, it’s something worth considering if you have cash to spare.

Now let’s hit the Virtus Global Multi-Sector Income Fund and the Kayne Anderson MLP Investment Company. Both funds are trading close to their NAV, and both are paying massive dividends—12% and 10.6%, respectively. So should income investors hold on or buy more?

To answer that question, we’ll take a look at this chart showing where their discounts to NAV stand relative to history:

The Big Picture

This chart makes one thing clear: KYN is now cheaper than it’s been through most of its history, where it tends to trade at a premium to NAV. On the other hand, VGI’s discount, while off a bit from the last few months, is narrower than it usually is.

That makes one thing clear: buying more KYN and waiting for it to revert to its historical mean looks like a smart move, while cautiously adding VGI is also practical, since it’s a strong fund with a very good portfolio.

So if you’re sitting on cash, 3 of these funds still deserve your attention. And thanks to the 500-strong CEF market, there are a lot more out there, too—starting with the 14 I want to tell you about now.

One Click for the 14 Best Funds of 2018

That’s right—you can skim right through all the 500 or so CEFs in the world with just one click and go straight to the 15 funds with the highest yields and biggest gains ahead in 2018 (I’m talking SAFE dividends up to 9.6% and double-digit upside).

All you need is a no-risk 60-day trial to my CEF Insider service. And your timing is perfect, because I’m making a limited number of these trial memberships available now!

Simply CLICK HERE to start your no-obligation trial. When you do, you’ll get instant access to the names, tickers and my complete research on each and every one of the 15 cash machines in the CEF Insider portfolio.

These 15 bargain CEFs all trade at absurd discounts to NAV that are slowly narrowing. That puts unrelenting upward pressure on their share prices and sets us up for a market-crushing gain in 2018!

But the best part—by far—is the dividends.

Right now, the portfolio boasts an average yield of 7.4%. But remember, that’s just the average! Cherry-pick my 3 highest-yielding funds and you’ll be pocketing life-changing payouts like 9.6%, 9.55% and 9.0%!

I hope you’ll take this opportunity to join the small group of investors across the country who are pocketing regular monthly dividend checks from these 15 terrific funds.

Please don't make this huge dividend mistake... If you are currently investing in dividend stocks – or even if you think you MIGHT invest in any dividend stocks over the next several months – then please take a few minutes to read this urgent new report. Not only could it prevent you from making a huge mistake related to income investing, it could also help you earn 12% a year from here on out! Click here to get the full story right away. 

Source: Contrarian Outlook 

Stock Research Made Simple