Category Archives: Bear

Another Chart Shows a Recession Is Coming

The probability of a recession is rising. I recently highlighted how the Federal Reserve will trigger a recession at its December meeting.

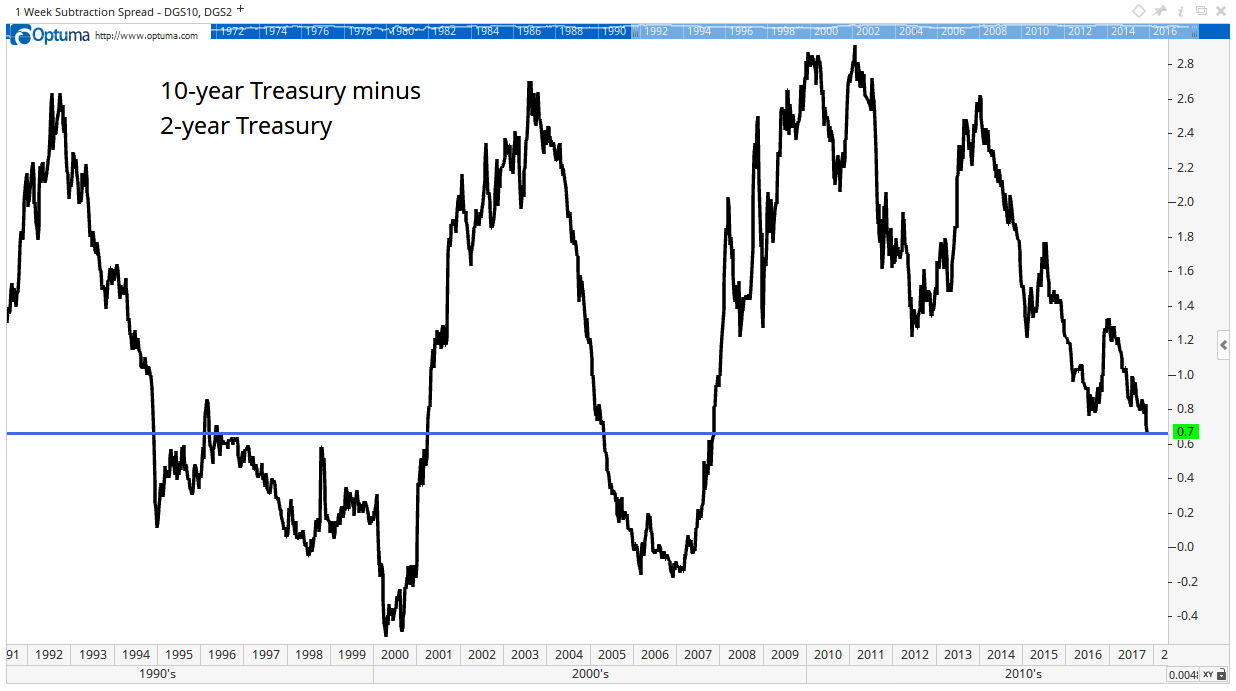
Now, market data confirms that research. The yield curve, a traditional recession indicator, is falling. It’s at a 10-year low. In fact, it’s only been this low twice in the past 20 years.

I recently highlighted how the Federal Reserve will trigger a recession at its December meeting. Now, market data confirms that research.

The yield curve is the difference between the interest rates of two different Treasury notes. This chart shows the difference between notes due in 10 years and in two years.

The interest rate on the 10-year Treasury is about 2.3%. On the two-year, the interest rate is about 1.6%. The difference is 0.7%.

A large and growing difference between the two rates indicates the economy is growing. That means investors are willing to pay more to borrow money. They pay more because they believe growth will increase the return on investments.

A falling yield curve shows investors are worried. They are no longer willing to pay high rates to borrow money. And the rate on the 10-year Treasury drops faster than the rate on the two-year.

Based on the previous two signals, the chart shows there is good news and bad news in this data.

The good news is that the market tends to rally when the yield curve drops to this level. The S&P 500 gained almost 30% in the 19 months after the yield curve dropped below 0.7% in 2005. In 1995, the signal kicked off a 300% rally.

Both rallies ended in crashes. That’s the bad news.

This data is consistent with the recession indicator I wrote about last month. The end of the bull market is near. But the gains before the top will be significant.

Regards,

Michael Carr, CMT
Editor, Peak Velocity Trader

In this exciting NEW VIDEO, Wall Street legend and former multibillion hedge fund manager Paul Mampilly pulls back the curtain on the biggest investment opportunity in the market today. What insiders are calling “The Greatest Innovation in History,” this revolution will mint more millionaires and billions than any technology that came before it. Right now, the current market for this technology is just $235 billion, but given how fast this technology is moving experts predict it will soar to $19 trillion by 2020. But 8,000% growth is just the beginning—and now’s your chance to get in on the action. [CONTINUE TO VIDEO]

Source: Banyan Hill 

Rising Debt Spells ‘Warning!’ for This Bull Market

Part of me feels great having had predicted this summer that oil prices, then in the mid-$40 a barrel range, were due to rise in a big way.

But there’s something to look out for while we watch oil break out toward $60 and perhaps higher. We may reap the windfall now, but the rise in oil prices could be planting the seeds of the next bear market in stocks.

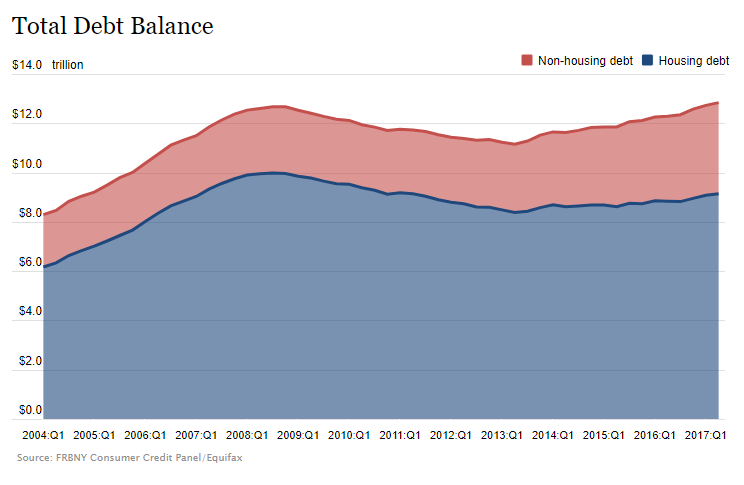
It’s all about consumer spending and the almost $13 trillion “elephant in the room” — better known by the Federal Reserve Bank of New York as Americans’ total amount of housing and nonhousing debt.

Every quarter, the Fed tabs up what it calls the nation’s “total debt balance” — mortgage debt plus nonhousing debt (loans for automobiles, credit cards, home equity and student loans).

At the last peak in the economy, in 2008, the nation’s total debt balance tapped out at $12.68 billion. We surpassed that milestone back in the first quarter of the year, when Americans’ accumulated an aggregate $12.72 billion that needs to be paid back.

It grew to yet another new record of $12.84 billion in the second quarter.

But what’s so interesting (and dangerous) is that it’s not mortgage debt, but all the nonhousing debt  that’s leading the charge higher in the statistics this time.

The Cost of Gasoline

Back in 2008, all those other kinds of loans made up about 21% of Americans’ total debt balance.

Today, the aggregate of financing our cars, college and credit cards makes up nearly 30% ($3.7 trillion as of the second quarter, according to the Fed).

What’s so interesting (and dangerous) is that it’s not mortgage debt, but all the nonhousing debt that’s leading the charge this time.

That’s why the newly rising price of oil is a big deal for the stock market.

If you believe the surveys that say 62% of Americans have less than $1,000 in their savings accounts … what does that tell you about their ability to absorb the additional cost of gasoline for their vehicles — without missing a payment on a credit/student/equity/personal loan of some kind?

When oil was above $100, the price of a gasoline futures contract was about $3 per gallon. As recently as this summer, it was half that price. But it has now climbed to $1.80 a gallon. What happens when it climbs to $2 or $2.25 a gallon in step with rising oil prices and the economy?

It’s that much less money that Americans have to spend on all the other stuff that makes the economy move — and underpins the rise in stock prices.

So let’s say you’re concerned about that possibility. What can you do about it? Fortunately, there are exchange-traded funds (ETFs) that give you options. One possibility is the ProShares Short S&P 500 ETF (NYSE: SH).

Like just about anything with a bearish tint in recent quarters, it’s been a one-way ticket to lose money. That’s always the case — until it’s not.

Kind regards,

Jeff L. Yastine
Editor, Total Wealth Insider

In this exciting NEW VIDEO, Wall Street legend and former multibillion hedge fund manager Paul Mampilly pulls back the curtain on the biggest investment opportunity in the market today. What insiders are calling “The Greatest Innovation in History,” this revolution will mint more millionaires and billions than any technology that came before it. Right now, the current market for this technology is just $235 billion, but given how fast this technology is moving experts predict it will soar to $19 trillion by 2020. But 8,000% growth is just the beginning—and now’s your chance to get in on the action. [CONTINUE TO VIDEO]

Source: Banyan Hill 

This Indicator Could Signal a Top

Stress. To us, it is measured by our pulse. Our economy, however, isn’t as easily tracked.

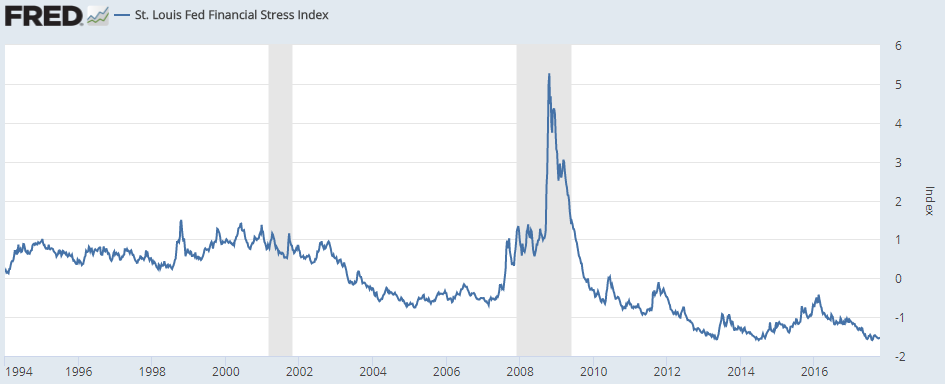
That’s why the St. Louis Federal Reserve has done its best to create a Financial Stress Index that tells the stress level of the economy.

The stress index, which is comprised of 12 weekly data indicators, is used to show when the economy is in certain stress situations — either above- or below-average stress.

Take a look:

The St. Louis Federal Reserve has done its best to create a Financial Stress Index that tells the stress level of the economy.

(Source: Federal Reserve)

The average is the zero line, so if the index is above zero, it’s above-average financial stress. Below zero, and below-average financial stress.

Right now, the index is at a reading of about -1.5, well below the zero line. In fact, it’s only been this low twice before, once in 2013 and once in 2014.

When the financial stress of the economy is higher, there’s a threat of a pullback in the stock market.

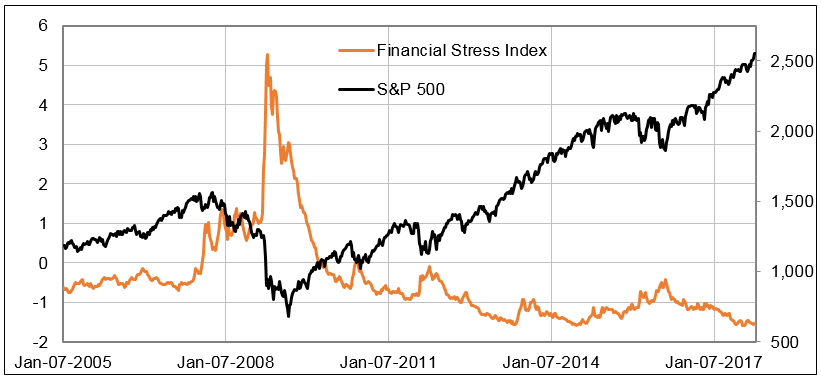
Take a look at the inverse relationship between the index and the S&P 500.

The St. Louis Federal Reserve has done its best to create a Financial Stress Index that tells the stress level of the economy.

Clearly, as the stress index (orange line) spikes higher, there’s almost always a pullback in the S&P 500 (black line).

Since we are at very low levels for the index, we know at some point financial stress will get worse.

So, what are some possible reasons for it to be worse?

Well, based on the indicators it uses, interest rates and yield spreads are the biggest factors. And President Donald Trump is eyeing John Taylor as the new Fed chair. Taylor is considered to be the most hawkish candidate on policy, meaning he is looking to raise rates at a more rapid pace than we have seen.

Trump’s decision will create moves in the interest-rate market over the next three to six months, so it could easily be the catalyst that creates a bottom in the stress index — and therefore a possible top in the stock market.

Regards,

Chad Shoop, CMT
Editor, Automatic Profits Alert

It’s not silver or platinum. It’s not aluminum, nickel or lithium, either. But this “magic” METAL is found in everything from cars to airplanes, smartphones and computers, even batteries and cosmetics. It even has the power to fight diabetes, depression, weight loss and cancer. It’s worth billions, even trillions. But here’s the problem—this metal is disappearing. The world’s reserves are quickly being sucked dry. But a group of geologists have just struck the motherlode, and the one company behind it could earn investors an absolute fortune as they solve the greatest commodity crisis in human history. [FOR MORE INFORMATION CLICK HERE]

Source: Banyan Hill

Wall Street’s Glory Days Are Numbered

“Welcome to Wall Street,” said the investment banker.

The year was 1989, and my college’s financial club had organized a trip to the New York Stock Exchange.

Our guide led us to the floor of the exchange because, back then, that’s where all the action took place.

Orders came flying in by phone, and some people even had portable devices to keep track of their stocks on the go.

As the open got closer, the noise rose to where you could barely hear the person standing next to you. But that was nothing compared to when the minute hand of the clock struck 9:30.

The minute we heard the “ding, ding, ding” of the opening bell, it was pure pandemonium.

Today, the floor is a little less exuberant, being mostly there for show now that a good portion of today’s trading takes place via computers.

But even though Wall Street’s essence has remained the same since it began in 1792, I believe its glory days are numbered.

See, Wall Street still has a monopoly on one essential part of trading … but in time, the internet is going to wipe out this current advantage.

Cutting Out the Middleman

Right now, Wall Street is made up by an army of middlemen.

These are your investment bankers, securities exchanges (like the New York Stock Exchange and the Nasdaq), corporate lawyers, analysts, consulting companies, auditors, accounting firms, rating agencies and all-around paper pushers.

These entities exist for one main purpose: to help sell equity or stock to the public. So if you want in on the action, you have to go through this vast network.

And for this monopoly, you pay a heavy price.

According to PwC, an elite consulting company, investment banks charge a 5% to 7% fee to do an IPO, or initial public offering. This is the first time that a company’s stock is offered for sale to the public.

That means if your company’s IPO is worth $1 billion, investment bankers net as much as $70 million in fees.

However, that’s just the beginning…

Exorbitant Fees Cannibalize IPOs

According to a survey of registrations filed by the Securities and Exchange Commission — an arm of the government that regulates stocks — the average cost of these middlemen’s fees amounts to $3.7 million.

While that may sound like a lot of money to you, I actually believe that this average is way too low.

Bottom line: It costs way too much to become a publicly traded company today.

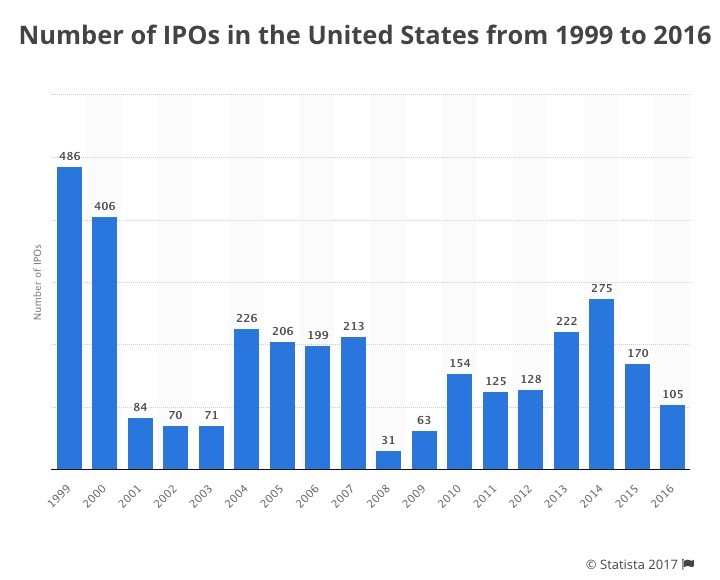
The best evidence of this is the lack of IPOs. After peaking in 1999 with 486 companies going public, IPOs have since crashed.

In 2008, just 31 companies became publicly traded.

And 2016 marked the lowest number of companies going public in nearly a decade, with only 105 IPOs.

Wall Street still has a monopoly on one essential part of trading … but in time, the internet is going to wipe out this current advantage.

A Better Way to Go Public

It’s clear that more companies are choosing to stay private longer.

But now, these companies will have a new way to get their shares and stock to people wanting a slice of the pie.

This new process is called an ICO/ITO, or initial coin/token offering, which is being popularized by cryptocurrencies.

Basically, this is the process of digitizing an asset to make it publically traded via the internet. And if used to sell stocks, this process has been shown to dramatically reduce costs.

According to one Quora user, an ICO can be done for as little as $100. On the high end of the spectrum, an expensive ICO might cost $300,000, said a lawyer on the same site.

That’s still peanuts compared to the $70 million an investment bank will charge your $1 billion company. Or the lowball $3.7 million estimated fees you’d pay an army of middlemen to do an IPO.

Now, to my knowledge, no one has gone this route yet. But the dramatic cost reduction in doing an ICO/ITO offering vs. an IPO means it’s only a matter of time before someone tries this method out.

And once a successful model has been built, it’ll be curtains for Wall Street’s current IPO business.

That’s one of the reasons I’m staying away from traditional Wall Street companies in my services.

Instead, I’m looking for companies that are going to benefit from the new school of finance — be it through ICO/ITOs, mobile payments or even the implementation of blockchain technology.

These trends are the future of investing, and they’re what I research in my flagship Profits Unlimited newsletter. So, if you too want to explore the cutting-edge areas of finance — before other people even hear about them — I encourage you to read up on my service.

Regards,

Paul Mampilly
Editor, Profits Unlimited

In this exciting NEW VIDEO, Wall Street legend and former multibillion hedge fund manager Paul Mampilly pulls back the curtain on the biggest investment opportunity in the market today. What insiders are calling “The Greatest Innovation in History,” this revolution will mint more millionaires and billions than any technology that came before it. Right now, the current market for this technology is just $235 billion, but given how fast this technology is moving experts predict it will soar to $19 trillion by 2020. But 8,000% growth is just the beginning—and now’s your chance to get in on the action. [CONTINUE TO VIDEO]

Source: Banyan Hill

The Fed Is Set to Trigger a Recession in December

The Federal Reserve’s job is easy to understand in some ways.

It cuts interest rates when the economy slows. Making money cheaper should lead to economic growth.

Then, when the Fed feels the economy is growing too fast, it raises rates. It keeps raising rates until it starts the next recession. And then the Fed starts over again.

The details are a little more complex than that. But this is what the Fed does.

In its defense, the Fed tries to stop raising rates before it starts a recession. But that’s hard to do, and it usually isn’t successful.

This pattern explains why investors watch interest rates so closely. And history tells us rate watchers are about to get big news. The Fed is weeks away from triggering the next recession.

The Fed Funds Forecast

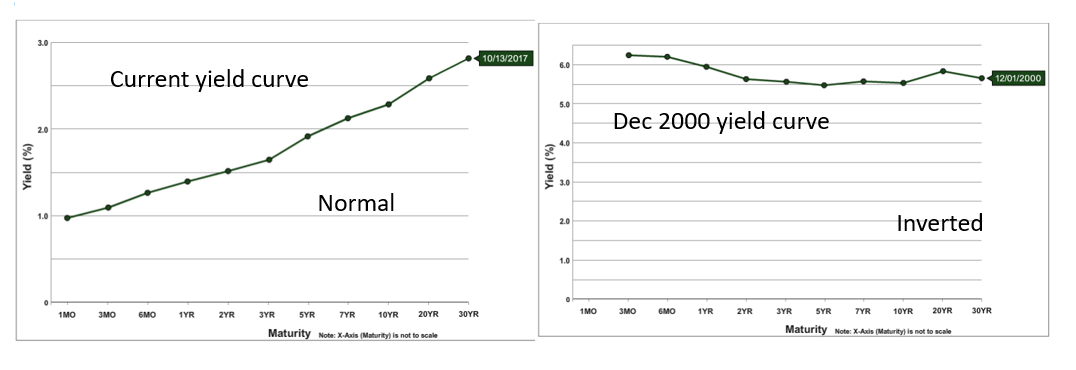
Market watchers have a variety of techniques to forecast recessions. The most popular is to watch for an inverted yield curve. The chart below shows normal and inverted yield curves.

The Fed tries to stop raising rates before it starts a recession. But that’s hard to do ... and it usually isn’t successful.

(Source: U.S. Treasury)

The yield curve shows the interest rate at different times. For example, right now the yield curve tells us a short-term interest rate known as the fed funds rate is about 1.15%, while the interest rate on 10-year Treasury’s about 2.3%.

This is normal, with long-term rates higher than short-term rates. But before a recession, we usually see short-term rates move above long-term rates. That’s called an inverted yield curve because rates are upside down.

This indicator predicted seven of the nine recessions since 1955, a 78% success rate. There were two false positives, a time when the yield curve inverted and no recession followed.

The inverted yield curve is a pretty good indicator. But economists at Wells Fargo developed a better indicator. Their tool identified all nine recessions but gave a total of 13 signals.

Three of the four false positive signals came right before market sell-offs. On average, the S&P 500 fell 11% within a year of the signal.

With this track record, this is an important indicator to watch. And we won’t have to watch for long. It’s expected to give its next signal at about 2 p.m. EST on December 13.

That’s when the Fed will announce if it decided to raise short-term interest rates at its two-day meeting. Right now, there’s a 93% probability of a rate hike, according to traders in fed funds futures.

That rate increase will activate Wells Fargo’s recession indicator.

On the Distant Horizon

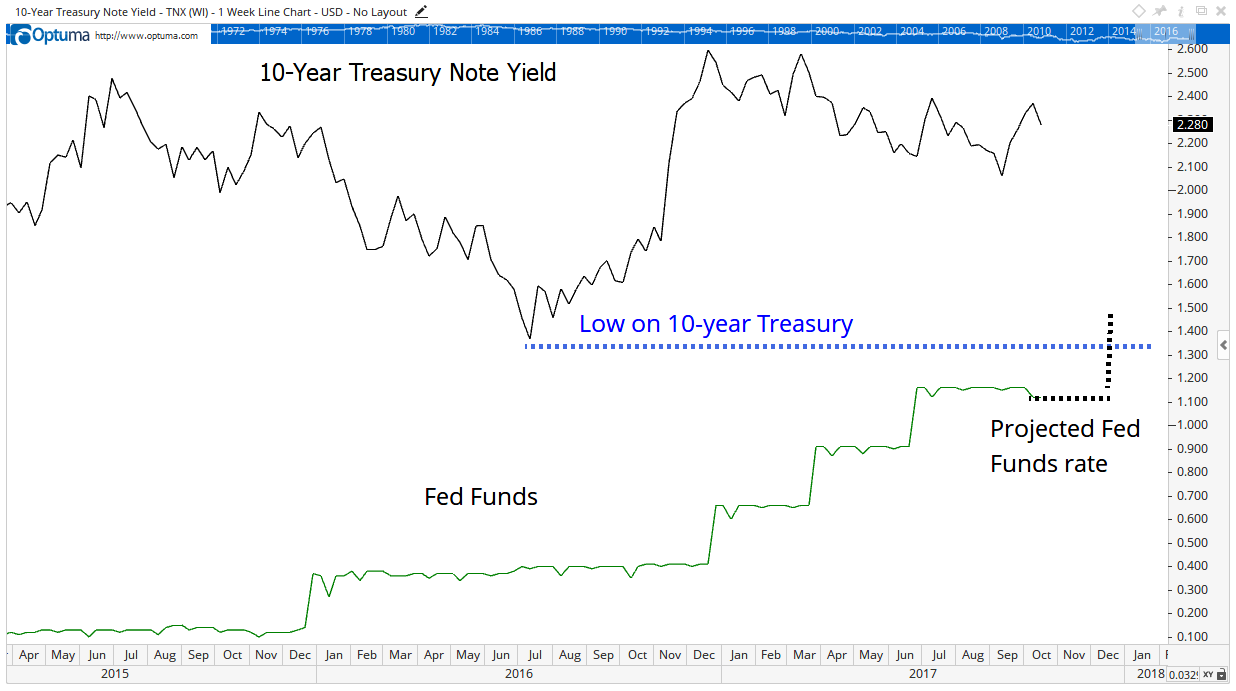
The indicator says to expect a recession when the fed funds rate exceeds the previous low of the 10-year Treasury. The next chart summarizes the indictor.

The Fed tries to stop raising rates before it starts a recession. But that’s hard to do ... and it usually isn’t successful.

The expected increase in interest rates will push the fed funds rate to about 1.38%. This is above the previous low of the 10-year Treasury, which was 1.34%.

The recession indicator isn’t a pinpoint timing tool. Recessions followed signals by six to 34 months in the past, with an average lead time of 17 months.

We should expect the next recession to occur in late 2018 or early 2019. This has important implications for investors.

Stock prices fall during a recession. They usually start falling before the recession, an average of six to 12 months before the recession.

Next year, we could see the start of the bear market. That’s the bad news.

But there’s lots of good news.

The stock market usually soars higher before the bear market begins. The S&P 500 gained an average of 22% in the year before the previous three recession peaks.

With a recession on the distant horizon, investors should be buying stocks in preparation for the rally that precedes the crash.

Regards,

Michael Carr, CMT
Editor, Peak Velocity Trader

I can’t believe this “surfer dude” beat all those Wall Street legends... ​650 of the world’s biggest and brightest minds... I’m talking about legends like Mario Gabelli... David Einhorn... Joel Greenblatt... and Rick Rieder... who, combined, manage more than $5 trillion. All were forced to bow down to one “unheard of” trader from Laguna Beach. Click Here to discover the strategy he used while he had sand between his toes.

Source: Banyan Hill 

Which Gets You Richer: Starting a Company or Investing in One?

A couple years ago, I bumped into John Dessauer, editor of John Dessauer’s Outlook, at the exhibit hall of The MoneyShow in Orlando.

He spied The Oxford Club logo on my lapel.

“I know Bill Bonner,” he said, referring to the Founder and President of Agora Publishing, the parent company of The Oxford Club. “I worked for him when he was broke.”

I smiled and nodded. “He’s not broke now.”

More than 30 years ago, Bill Bonner founded a tiny company that has become the world’s largest publisher of health, travel and investment letters, becoming a near-billionaire in the process.

He once told me that the company survived the early years only because he “was a pretty good copywriter… and a pretty good plumber.”

I’m not sure how he did it. Bill claims he doesn’t know either.

Yes, he understands the industry, devoted his life to it and hired some smart people who hired a lot of other smart people. But, in my experience, Agora is truly a one-off.

Newbies find the freewheeling, largely unstructured, internally competitive, risk-prone nature of the company either totally invigorating or completely petrifying. Employees are encouraged to be creative, ambitious and entrepreneurial and are given plenty of freedom and incentives – or enough rope to hang themselves, depending on how you look at it.

When Bill gives advice – which he rarely does, even when it is solicited – it generally pays to listen.

“More Than Just the Annual Profits”

Yet I’ve found myself in disagreement with him lately. In his first Daily Reckoning column of 2015, he argued that the best way to generate and preserve wealth is not by investing in the stock market, but by starting your own business.

According to Bill…

Owning and controlling a business is a much better way to make money [than owning stocks].As a general rule, the closer you are to the source of earnings, the more you are likely to get. When you control a business, you make sure you get your share of the profits. When someone else controls the business, he often makes sure you don’t.

Owning your own business brings you more than just the annual profits. You also can get employment, use of company cars and real estate, and a business credit card to cover some of your expenses. You get invited to the company holiday party, too.

And if you pay attention, you understand how the business works and what it is worth.

This is different from the passive owner of a few publicly traded shares.

Indeed, it is. And yet…

Do You Have What It Takes?

According to the U.S. Bureau of Labor Statistics, the majority of new businesses fail within the first four years. That’s a daunting consideration for anyone contemplating a new enterprise.

You may not have enough money to start a business – or access to enough capital to keep it going.

Consider the time involved, commonly known as “the burden of retail.” As a new business owner, you will be the first to arrive, the last to leave and the last to get paid.

Do you have the expertise? Do you know your market? Will you be able to balance the competing demands of customers, suppliers, employees and creditors?

Do you have a knack for hiring good people? That can be a tricky business.

In my experience as a manager, I’ve found that roughly 20% of employees do more than what they’re asked, take whatever actions are needed to get a job done, learn the skills they need to help the business and their career, and are the foundation of everything you do. (Your biggest problem will be challenging and retaining them.)

Seventy-five percent of employees do no more or less than what’s required and are in the parking lot by 5:01. (That’s fine, incidentally. They work to live and find fulfillment elsewhere.)

The other 5% tend to be gadabouts, shirkers, malingerers or troublemakers and need to be shown the door as quickly as possible.

This is tiring. At least it was for me.

Even if your business is a roaring success, that may change. A family in my hometown owned a profitable furniture store for generations. Within a matter of months, it went bust.

I used to know a lot of wealthy homebuilders. Today I know none.

There are quality of life issues, too. When you run a business, it is never far from your mind. You spend a lot of time with bookkeepers, lawyers, tax consultants, disgruntled employees and dissatisfied customers. Is this how you want to spend your day?

That’s why I prefer another type of business ownership: stocks, the best-performing asset of the last 200 years.

A Whole Lot Simpler

Even if you lack the time, investment capital or experience necessary to found and run a successful business, with even a modest amount of money you can accumulate a stake in many of the world’s greatest businesses.

And it’s easy. A click of the mouse, a $5 commission, and you’re in. Another click – another $5 – and you’re out. (Compare that to your typical real estate closing.)

Owning a piece of a company is a whole lot simpler than running one. You don’t have to take out loans, sign personal guarantees, hire or fire employees, grapple with an avalanche of federal mandates and regulations, pay lawyers and accountants, or even show up for work. How great is that?

Some Americans today obsess over the issue of fairness. But the stock market shines here, too. If I own shares of Microsoft, for example, my gain over the next year will be exactly the same as the world’s richest man. Sure, Bill Gates may own a few more shares than I do, but our percentage returns will be the same.

Monitoring your portfolio has never been simpler either. You used to have to dig the price of your stocks out of the business section of the paper. (When was the last time you did that?) Or you could call your broker, get placed on hold for a few minutes, and eventually get a quote that – by the time you received it – was no longer current.

Today you don’t think twice about getting a real-time quote, placing a trade with a click and getting a near instantaneous confirmation.

Costs used to be exponentially higher, too. Brokers routinely sold mutual funds with front-end loads as high as 8.5%. (That’s not a misprint.)

Prior to May 1, 1975, brokerage commissions were steep – and fixed by law. Deregulation – and the debut of Charles Schwab – changed that. The internet steamrolled costs further still.

Spreads are far thinner today, too. When I started in the brokerage business 30 years ago, a large stock might have an eighth of a point spread – and a small one, a quarter of a point. Tack on a 2% or 3% commission, and you were down 5% by the time you got your trade confirmation.

Today – thanks in part to wrongly detested, high-frequency traders – liquidity is greater than ever and bid-ask spreads are often a penny.

The Easiest Way to Build a Fortune

Your investment choices have never been greater. Information has never been more widely available. Monitoring your portfolio has never been simpler. Spreads have never been thinner. Commissions have never been lower. Executions have never been swifter.

Owning a diversified portfolio of stocks is far less risky than tying up your money – and your life – in a single company.

Moreover, the same factors that could undermine a publicly traded company – debt, competition, inflation, a weak economy, etc. – can just as easily hurt a privately held one.

True, private business owners don’t see a share price that suddenly belly-flops from time to time. But every business is fluctuating in value each day, whether you see it or not.

Owning a diversified portfolio of high-quality stocks means you will definitely experience neck-snapping volatility from time to time. That’s the price of admission.

But if you have the patience and the temperament, it is the safest, easiest and most liquid way to build a fortune.

Bill’s suggestion? That’s the second-best way.

Good investing,

Alex

Get up to 14 dividend paychecks per month from safe, reliable stocks with The Monthly Dividend Paycheck Calendar, an easy-to-use system that shows you which dividend stocks to pick, when to buy them, when you get paid your dividends, and how much.  All you have to do is buy the stocks you like and tell them where to send your dividend payments. For more information Click Here.


Source: Investment U

October Begins the Best 3 Months of the Year

No matter who you are, there’s at least one thing you like about the last three months of the year.

This is the time of year when holidays cluster. Schools and workplaces close. Families gather to celebrate.

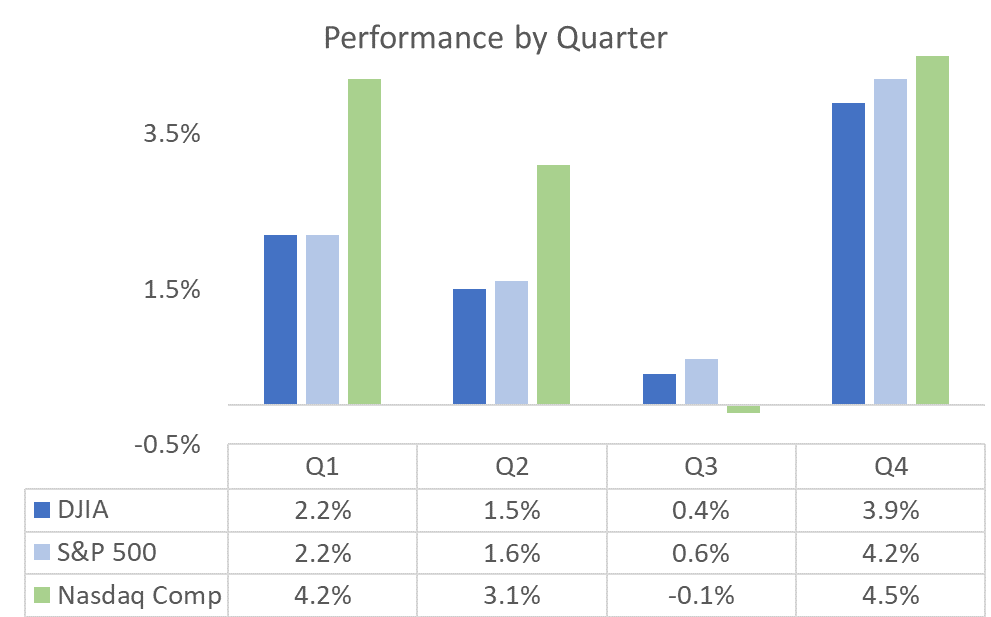
As an investor, I like the fact that stocks deliver their best returns of the year in the last quarter.

In an average year, the Dow Jones Industrial Average and the S&P 500 produce half of their gains in this three-month period. For the Nasdaq Composite Index, the gain in the last three months of the year is about 40% of the annual average return.

Skeptics might question this trend. They may believe there’s no reason for this behavior. But there is.

Swinging for the Fences

Stocks go up when investors add money to their investment accounts. In the fourth quarter, individuals and professionals create demand for stocks.

In an average year, the Dow Jones Industrial Average and the S&P 500 produce half of their gains in this three-month period.

Individuals might fund retirement accounts as the end of the year approaches. They might also fund educational accounts as news stories about tuition costs scare them into action.

Professionals also buy in the fourth quarter. Annual reports to shareholders list all the positions they own. Managers sometimes take part in “window dressing” to make those reports look better.

Window dressing is a powerful motivation.

Bonuses for hedge fund managers depend on fourth-quarter performance. Better performance means a better bonus.

This is often the time of year when managers “swing for the fences” and make aggressive trades in pursuit of a bonus.

Once again, skeptics might not want to believe something like window dressing exists. Academic studies confirm managers sometimes buy stocks just to show off. But studies confirm this doesn’t really help the managers.

One study concluded: “Window dressers also have poor past performance, possess little skill, and incur high portfolio turnover and trade costs, characteristics which, in turn, result in worse future performance.”

A Time to Buy

Now, since window dressing exists, it can benefit highly skilled investors.

Knowing the fourth quarter could deliver large gains, investors should buy aggressive stocks. If you’re not comfortable picking stocks, buy ETFs that track aggressive indexes.

An ETF is an exchange-traded fund. These are investments that trade, like stocks. An ETF usually owns a collection of stocks, like the stocks that make up the S&P 500 Index.

In the fourth quarter, the best ETF to own is the PowerShares QQQ ETF (Nasdaq: QQQ). This ETF tracks the Nasdaq 100 Index and includes companies like Facebook, Amazon, Apple, Netflix and Alphabet (the parent of Google).

Now, the fourth quarter has also included some of the worst market crashes in history. In October 1987, the Dow fell 22.6% in one day. In 2008, the index declined more than 30% at one point.

Including those losses, history says this is a time to buy.

It will be important to manage risk, but it will also be important to accept some risk. Based on history, now is definitely not the time to avoid the stock market.

Regards,

Michael Carr, CMT
Editor, Peak Velocity Trader

Can a $10 Bill Really Fund Your Retirement? The digital currency markets are delivering profits unlike anything we’ve ever seen. ​23 recently doubled in a single week. And some like DubaiCoin have jumped as much as 8,200X in value in 18 months. It’ unprecedented... but you won’t receive any of the rewards unless you put a little money in the game. Find out how $10 could make you rich HERE. ​


Source: Banyan Hill