A couple of large covered call trades in Financial Sector Select SPDR ETF (XLF) imply smart money is taking a moderately bullish position on financial stocks. There is likely a cap to how high financial stocks can go due to lower interest rate expectations.
However, covered calls are mostly considered bullish trades because they generally make money when the stock goes up. These long-term XLF covered calls provide some ability for capital appreciation, add a small amount of yield, and offer a small measure of downside protection.
That’s why I’m sharing with you today my complete 5 hour, 11 part video training series.
Because after 20 years of trading options…for the first time anywhere…
I’m releasing everything I know about options in one private course.
All the intel I collected on the floor of the CBOE…
All the insider tips picked up as an options Market Maker…
All revealed in seven complete strategies with examples.
In total, to go through everything, I’ve clocked the course at five hours. With this complete course, I believe: In as little as 5 hours, you could master options as well as a seasoned trader.
Plus, have the confidence to trade 7 new strategies right away if you’re new to options or you’re looking to sharpen your skills… the seven strategies I’ll show you right now can help you.
Coffee is one of those consumable goods that you simply don’t want to mess with. The country may fall into a deep recession. The ocean may rise to levels that engulf the coastlines. A meteor at this moment may be hurtling towards Earth. And yet, it won’t stop coffee drinkers from going to buy their next cup of joe.
As an avid coffee drinker myself, I can certainly appreciate the necessity of a good cup of coffee. There’s even a better than average chance that I’d ignore an alien invasion in order to make sure my coffee supply was in full stock.
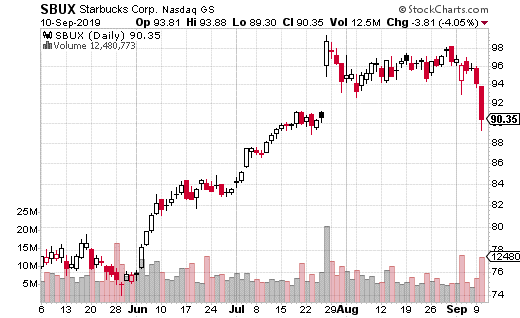
Of course, no one capitalizes on people’s love of coffee more than Starbucks (SBUX). The ubiquitous coffee chain now has over 31,000 stores worldwide. What’s more, the business seems to be nearly recession-proof. The company is one of the few out there which can seemingly continue to raise prices on its drinks without losing sales.
SBUX also does an excellent job of introducing new products to its mix to keep the menu from becoming stagnant. In fact, the company now sells more cold drinks than hot… an interesting trend for a coffee shop.
It’s been a great year for SBUX stock as well, up 40% so far year-to-date. The stock price reached 52-week highs of nearly $100 before recently pulling back to $90. So what’s next for the share price? Is it too late to buy the stock at these levels?
At least one prominent trader believes SBUX has limited upside through October. This trader purchased a large number of covered calls expiring in October with the stock trading at about $90.50.
More specifically, the trader bought 500,000 shares of stock while simultaneously selling 5,000 October 97.5 calls for $0.37. The position collects $185,000 in premium, which works out to about half a percent in yield for the next five weeks.
It may not seem like much but annualized that yield works out to about 5%. Tack that on to the 1.5% dividend yield and you are pulling in a decent income for a growth stock.
Of course, the covered call doesn’t cap the gains on the stock until $97.50, so the position can still generate another $7 in capital appreciation. Overall, this looks like a moderately bullish trade on the stock. Otherwise, if the trader didn’t assume the upside potential was there, the call would have been sold at a closer (to the money) strike to increase yield.
I like trades like this because they add a small yield component to a stock that is generally purchased for its aggressive growth characteristics. And while SBUX customers aren’t directly paying you the yield, it is their business which leads to the company’s growth potential, which gives the upside calls their value.
In other words, by making this trade – which does allow you to participate in some of SBUX’s upside potential – you are getting essentially getting paid a small income by coffee addicts (like myself)!Read this if you’ve ever lost money trading options
Does everything seem to go wrong right after you place an options trade?
You watch the stock and everything is going right.
Then you open the trade… and within an hour, you’ve lost money.
It’s not your fault. You just simply weren’t given the “behind the scenes” knowledge every options professional knows.
If you knew how they worked, in 2018 – when the markets lost 6% – you could’ve booked gains of:
127% in 23 days on GLD
148% in 28 days on SQ
229% in 36 days on SMH
213% in 13 days on Netflix
79% in 22 days on SPY
63% in 24 days on SPY
117% in 21 days on SPY
96% in 36 days on QQQ
114% in 42 days on MRVL
Just like I did.
The road to success for your first big, triple-digit options win is simple.
The funny thing about stocks this year is that it feels like we’re having a rough year. The last few months have brought quite a bit of volatility to the market, and with it comes the feeling that the stock market is struggling.
However, looking at the numbers, you may be amazed to see the S&P 500 is actually up 16% for the year. Moreover, the Nasdaq-100, comprised of most of the big tech names, is up over 20%. It doesn’t feel like a big up year for stocks, but it has been precisely that.
Most likely, investors feel like stocks have been struggling because most of the gains came before the summer. While we haven’t seen a correction so far this year, stocks are about 6% off 52-week highs. There’s almost always a recency bias when it comes to investing, so it should be of little surprise if investors have soured on the market.
Anecdotally, it seems like more investors are bearish on the remainder of the year. The uncertainty of the China trade war is weighing on stocks. There’s also been mixed signals from the Fed on its willingness to cover for the self-imposed battle of tariffs between the US and China.
On one hand, the Fed cannot ignore adverse economic developments, regardless of the cause. On the other hand, some in the Fed believe it’s not a prudent course of action to let the administration pursue controversial economic policies simply because the Fed can bail the U.S. out if the policies backfire.
Of course, all of this may be moot if lowering interest rates stop being a crutch for the economy. After all, there’s only so much further rates can go before getting into negative territory.
So what’s all this mean for stocks?
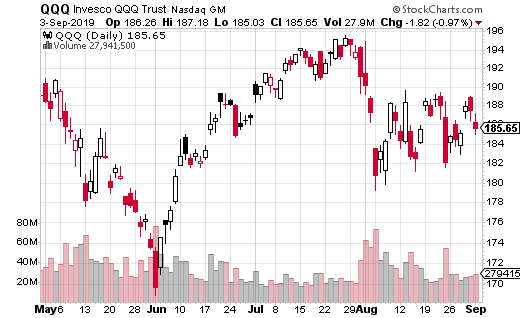
I took a look at options action in the Invesco QQQ Trust (QQQ) to see what traders think about the possibility of a Nasdaq-100 rebound. It turns out; there’s a least one considerable, very bullish trade which recently hit the tape.
A trader bought 1 million shares of QQQ at $186.17 while selling 10,000 December 20th 208 calls for $0.72. This covered call trade brought in $720,000 in premium, which works out to a 0.4% yield in not quite 17 weeks. The max gain is capped at $208, but that’s 12% higher from current levels.
Clearly, it’s a very low yield. Annualized we’re only talking about 1.2%. However, the dividend yield on QQQ is only 0.8%. If this covered call trade is made roughly every four months, the annual yield of holding QQQ shares climbs to a total of 2%.
And that is very likely the goal of this trade. Hold QQQ and keep the upside potential in the index, but earn 2% in yield over the course of the year. After all, tech stocks aren’t generally known as income stocks but are rather purchased for their growth potential.
In that respect, 2% isn’t a bad yield at all to receive for stocks with significant upside potential. And let’s not forget how low rates are right now and could be close to zero by year’s end.
Ultimately though, you have to view this trade as extremely bullish. If getting to $208 by the end of the year seemed impossible, the trader would have used a lower strike to collect more yield.
If you want to make a similar trade, it may make sense to use a lower strike and cap the upside of QQQ in exchange for higher income from the calls. However, if you use QQQ as your aggressive growth component in your portfolio, selling a much higher call like the trade above does make sense.
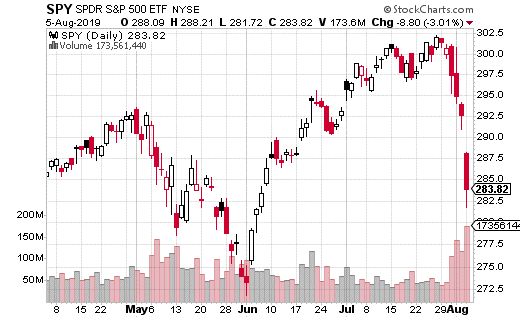
Investors have finally cracked under the pressure of the trade war with China. Stocks, which were at all-time highs just two weeks ago, are now 6% off those highs as of this writing. Although the S&P 500 is still up 13% year-to-date, Monday’s 3% drop set the alert level to red.
Meanwhile, safe-haven investments like gold and bonds are already up big in August. This is the sort of action you tend to see when investors have had enough of stocks. Up until this point, investors were assuming any negative impact from tariffs would be negated by the Fed lowering rates. It appears that’s no longer the case.
The futures market is now pricing in three more rate cuts this year, which places significant pressure on the Fed. The central bank may not want to cut rates further with the job market still hot; theoretically, it could lead to higher inflation. But, if the Fed leaves rates unchanged, there could be substantially more downward pressure on stocks.
There’s no easy answer here. The Fed can go only do so much. Moreover, the U.S, and China aren’t likely to back down from their trade demands, at least in the short-term.
However, let’s not forget the U.S. economy is still in pretty good shape. As I mentioned before, the job market is still smoking hot. We’re not exactly about to plunge into a severe recession.
So, do you buy the dip? Do you stuff your cash in a mattress? While there’s not an obvious solution, looking at the options market can provide some good ideas for how to trade this market.
There were a couple of big trades on Monday in the SPDR S&P 500 ETF (SPY) which caught my eye. Keep in mind, SPY is the most heavily traded ETF in the world and is used actively by retail and institutional traders alike.
Both trades which I’m referring to were covered calls. What? Covered calls during a major selloff? Indeed, covered calls are generally thought of as bullish trades, but they can be instrumental at risk-controlled bullish exposure.
Remember, a covered call is buying shares of a stock/ETF, but also selling calls against those shares. The income provided from selling calls can serve as a cushion to the downside, mainly if those call premiums are rich.
Both covered calls were done with SPY at $284.50. In one case 7,000 October, 292 calls were sold for $5.32 each. In the other trade, 7,000 December 292 calls were sold for $8.28. Combined, these trades brought in about $9.5 million in premiums.
The benefits of using a covered call in this situation are pretty obvious once you break down the strategy. Let’s use the October trade as an example.
Because the calls were sold for $5.32 with the stock at $284.50, the long (owned) shares of SPY are protected down to $279.18. However, the trade can still earn a profit on the upside all the way to $292 where the calls were sold.
Over the next ten weeks, this trade can generate nearly a 2% yield if the SPY hovers at these levels. It also protects against another 2% down move, as I mentioned above. What’s more, the trade can earn up to 4.5% if SPY goes back to $292 or higher by October expiration. The December trade is similar, but just tacks on a couple of months to the position.
While there is hardly a guarantee that the market is going to recover by October or December, it’s more likely we go up than continue plunging. Besides, at worst, these covered call trades are superior to simply buying and holding SPY due to the income/protection from the short calls.
If you’re looking to take a cautious, bullish position on the S&P 500, these types of trades are savvy ways of doing so.
An institution or fund purchased a massive number of put spreads in SPDR S&P 500 ETF (SPY). The put spreads were almost certainly purchased as a hedge against a major market selloff. The trader bought 15,000 put spreads which will pay off if the market drops over 5% in the next two weeks.
That’s why I’m sharing with you today my complete 5 hour, 11 part video training series.
Because after 20 years of trading options…for the first time anywhere…
I’m releasing everything I know about options in one private course.
All the intel I collected on the floor of the CBOE…
All the insider tips picked up as an options Market Maker…
All revealed in seven complete strategies with examples.
In total, to go through everything, I’ve clocked the course at five hours. With this complete course, I believe: In as little as 5 hours, you could master options as well as a seasoned trader.
Plus, have the confidence to trade 7 new strategies right away if you’re new to options or you’re looking to sharpen your skills… the seven strategies I’ll show you right now can help you.
Kids may be getting out of school, but it doesn’t seem like most traders are ready to go on vacation. In fact, it appears that many market watchers are glued to their screen. There’s undoubtedly been a lot more volatility over the past couple weeks than what we’ve gotten used to as the summer approaches.
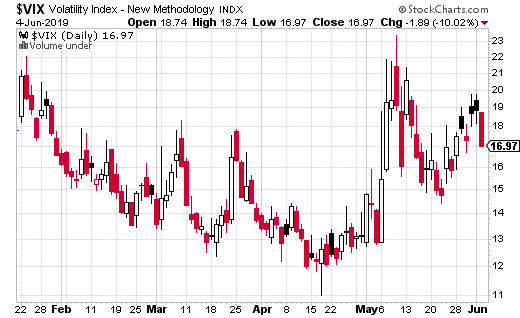
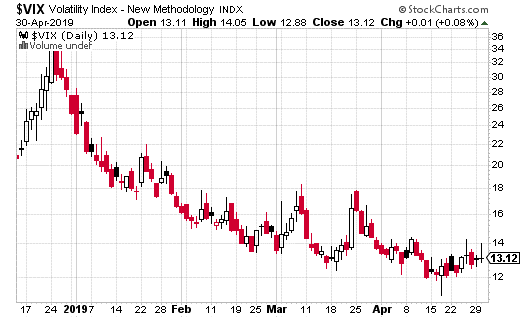
Much of the market volatility (as commonly measured by the VIX) started in mid-May. The VIX (which measures the volatility of S&P 500 options) climbed above 20 for the first time since December 2018. It was at that point when it became clear there would be no easy solution to the trade war with China.
Because the tariff battle with China has been an issue for some time, the market may have settled down had it been the only negative headline to surface. But, not long after, sanctions against Huawei (the massive Chinese telecom company) were announced. This dealt another blow to stocks (particularly chip stocks, several of whom are big suppliers to Huawei).
But that’s not all…
Just recently, the White House announced a potential 5% tariff on Mexican goods, which sent stocks lower the following day.
There are several reasons why this could be a much bigger deal than the China tariffs. First of all, Mexico is a much bigger trade partner with the US than China. Second, the tariff is supposed to be contingent on Mexico reducing the flow of immigrants to the US – a situation where there’s not a cut and dry solution to the problem.
To top it all off, at the start of the week news broke that the US government is looking into anti-trust cases against the FANG companies. When it became known, it sent tech stocks into a nosedive for obvious reasons.
The VIX, which had settled down back to 15 since its spike in May, climbed all the way back to 20 at the start of June. It wasn’t looking pretty out there for stock investors. Fortunately (for bulls anyway) the Fed came in to save the day (once again).
Fed Chairman Powell said the Fed would be willing to lower rates to combat the negative impact of the tariffs. An accommodative monetary policy was just what the market wanted to hear – as evidenced by the 2% jump in the S&P 500 on the day Powell spoke.
Market volatility also pulled back on the dovish interest rate news. The VIX dropped from 19 to 17 in just one trading session. It certainly helped that the futures market began predicting a rate cut at the July FOMC meeting with a 60% probability of happening.
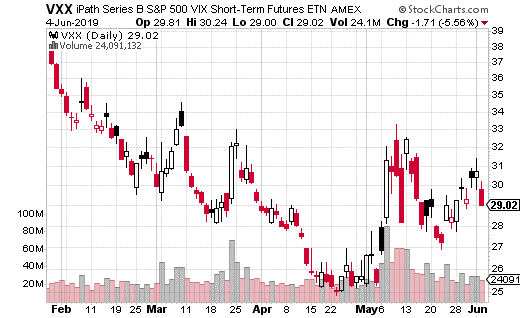
Options activity in the most heavily traded VIX ETF, the iPath S&P 500 VIX Short-term Futures ETN(VXX), also suggests a coming decrease in volatility. The Fed may have bought the market some time to relax with the interest rate news.
One interesting trade in VXX from this past week was a put ratio spread expiring the first week of July. With VXX at $29, the trader bought 1,000 26.5 puts and sold 2,000 24.5 puts. The total cost of the trade was $0.30.
The reason twice as many of the lower strike puts were sold was to substantially reduce the cost of the trade. Now, VXX only has to reach $26.20 over the next month for the trade to breakeven.
The tradeoff is the position has unlimited risk below $24.50. However, given the current market environment, a drop below that price seems unlikely at best.
If you believe the Fed will keep a lid on volatility, you can make a similar trade in VXX. Instead of doing a ratio trade and taking on the additional risk, you could do a simple the July 5th 24.5-26.5 put spread 1 x 1 (buying the 26.5 puts and selling the 24.5 puts).
That trade would cost about $0.57, putting your breakeven point at just under $26. Max gain is $1.43, which works out to be 251% gains if VXX ends up at $24.50 or below.
Buffett just went all-in on THIS new asset. Will you? Buffett could see this new asset run 2,524% in 2018. And he's not the only one... Mark Cuban says "it's the most exciting thing I've ever seen." Mark Zuckerberg threw down $19 billion to get a piece... Bill Gates wagered $26 billion trying to control it... What is it? It's not gold, crypto or any mainstream investment. But these mega-billionaires have bet the farm it's about to be the most valuable asset on Earth. Wall Street and the financial media have no clue what's about to happen...And if you act fast, you could earn as much as 2,524% before the year is up. Click here to find out what it is.
The trade war with China is having far-reaching effects on the market. The impact is being felt across most industries and business types despite trade with China only accounting for a relatively small portion of GDP. It just goes to show how tied into the global economy most US companies are these days.
It’s also very interesting to see how traders are positioning themselves due to or in anticipation of the economic conflict. It’s clear that most of the short-term trades have been bearish (just look at chip makers and agricultural stocks for example). However, in the long-run it wouldn’t surprise me to see investors quietly loading up on good companies which will rebound when the trade war is over.
Of course, trying to time the end of the trade war is probably a fool’s game. Who knows how long this situation will drag on and what the results will be. It’s also impossible to know how the crowd will react to any piece of related news.
As I’ve already pointed out, actual trade with China is not a huge part of our economy. I believe the heavy selling in certain stocks has to do with lowered expectations more than anything. The market doesn’t like bad news in any form.
There is also the issue of interruption of the global supply chain. That may be more of a concern as it isn’t easily quantifiable. For instance, what happens to the US soybean crop if China is no longer a big buyer? It’s not just the farmers that are impacted. Think of the bulk transportation and the storage capacity involved.
There’s certainly more to tariffs than just paying a higher price for goods. The impact may not fully known for some time.
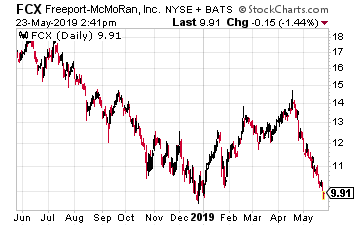
Still, it’s not hard to find some very interesting options trades which are likely related to effects of the trade war. I just came across an intriguing trade in Freeport-McMoran(FCX)a company most certainly influenced by the tariffs. FCX’s main product is copper, and in recent years, China has been the world’s biggest consumer of copper (a big component of industrial production and residential construction).
At least one strategist believes FCX may have limited upside through the summer. The trader executed a large covered call trade, which is moderately bullish for the stock. The trade generates a bit of income while allowing for some upside appreciation in the stock.
More specifically, with FCX trading at $10.28, the trader purchased 350,000 shares and sold 3,500 September 12 strike calls against the stock. The calls were sold for $0.44, which amounts to $154,000 in premium.
This covered call does a few different things. First off, the 44 cents in income provides a cushion down to $9.84 in the share price before the trader loses money. That 44 cents also provides a juicy 4.3% yield over a 4-month period. Annualized, that’s about 13%.
Furthermore, since the 12 calls were sold, there is upside potential in the stock up to $12. That’s an additional $1.72 that can be made, or 16.7%. All told, the covered call can make 21% in 4 months if FCX gets to $12 or above.
You can see from the chart that FCX has clearly not been a favorite of investors. However, this big covered call trade I just described could be a signal that some (likely savvy traders) believe the stock is near a bottom.
Moreover, this is a trade you could easily (and inexpensively) set up in your own account. Almost certainly, any positive news about the trade war will cause an upturn in the stock. And if not, you are still generating a nice yield to hold the shares through the summer.
Up until last February, the Cboe’s VIX (S&P 500 Volatility Index) was the only market volatility index which could be traded through derivative products. The index itself is not tradeable, but VIX futures, options on those futures, and VIX-related ETFs are all widely popular products. While the usage of these products varied based on the user, the one thing they have in common is using the VIX as the underlying instrument.
However, in February, the SPIKES index launched on the MIAX exchange – a collaboration between T3 Indexes and the MIAX itself. SPIKES is similar to the VIX in that it measures market volatility using options on the S&P 500. However, the VIX uses SPX options for pricing purposes (the S&P 500 index itself), while SPIKES relies on SPDR S&P 500 ETF(SPY) options for its calculations.
So how can SPIKES compete against the 500-pound VIX gorilla? In order to attract customers, SPIKES offers significantly lower fees than VIX. SPY also tends to be more liquid, with more active strikes than the SPX. This is particularly important in times of high volatility, where price accuracy can be an issue if liquidity dries up. (SPIKES also uses a proprietary price-dragging method to keep accurate prices in place if things get too crazy.)
In the coming months, MIAX will likely launch SPIKES futures to go along with the existing options market. The addition of futures should allow SPIKES to compete on an equal basis with the VIX. It also means SPIKES-based ETFs will be a possibility down the road.
But what about the performance? While the SPX and SPY are very similar instruments, they aren’t identical. In fact, the big difference comes from the SPY offering a quarterly dividend (which isn’t the case with SPX). So then, historically, how do the VIX and SPIKES compare?
A new white paper by Dr. Peter Carr delves into this issue. First off, Peter Carr is perhaps the most respected name in options and volatility research. He is to this field what Warren Buffett is to value investing.
Dr. Carr is chair of the Department of Finance and Risk Engineering at NYU. He was previously managing director of market modeling at Morgan Stanley. He’s also won just about every accolade available in the field of financial engineering and risk modeling. All that is to say, you can bet any paper by Peter Carr is going to be immediately taken as if written on stone tablets.
So what did Dr. Carr discover in his research?
First and foremost, in the period from 2005 to 2018, the difference between SPIKES and VIX was negligible on average. In other words, from a medium to long-term view, you could have used the two indexes nearly interchangeably.
In the short-term, there were some noticeable differences around SPY’s quarterly dividend, as you’d expect. Most of this different was due to what’s called the early exercise premium, a phenomenon exclusive to American-style (early exercisable options). In a nutshell, the ability for SPY options holders to exercise their options early (to collect a dividend once a quarter) can cause a higher level of volatility in the options around those periods.
There are few points to consider. The early exercise premium is influenced by both dividends and interest rates, although interest rate contributions to options pricing are usually minor. Furthermore, the impact of the early exercise premium is probably not very impactful to out-of-the-money options, from which both the VIX and SPIKES are largely priced.
Here’s the bottom line. If we assume constant interest rates and dividend yields the difference between SPIKES and VIX due to the early exercise premium is generally trivial. When there is uncertainty surrounding these variables (generally in the short-term) there can be an additional volatility premium in SPIKES.
To put it simply, there may be a short-term period where SPIKES is higher than VIX when dividends are a factor. This is due to the extra volatility of the early exercise premium. How big that gap can get is something that will certainly be researched by interested parties. In the meantime, savvy investors may be able to take advantage of this gap to make money when it occurs.Read this if you’ve ever lost money trading options
Does everything seem to go wrong right after you place an options trade?
You watch the stock and everything is going right.
Then you open the trade… and within an hour, you’ve lost money.
It’s not your fault. You just simply weren’t given the “behind the scenes” knowledge every options professional knows.
If you knew how they worked, in 2018 – when the markets lost 6% – you could’ve booked gains of:
127% in 23 days on GLD
148% in 28 days on SQ
229% in 36 days on SMH
213% in 13 days on Netflix
79% in 22 days on SPY
63% in 24 days on SPY
117% in 21 days on SPY
96% in 36 days on QQQ
114% in 42 days on MRVL
Just like I did.
The road to success for your first big, triple-digit options win is simple.
Whether or not it’s worth investing in IPOs always seems up for debate. It almost certainly varies from company to company. However, one thing that most investors agree on is that IPOs are interesting to talk about and can be fun to follow.
After several mostly dull years on the IPO front, 2019 seems like it could be quite a bit more interesting. We’ve already had Levi Strauss(LEVI) and Lyft(LYFT) come out with big IPOs. We could have Uber and Pinterest in the near future. Later in the year, we may get Airbnb, WeWork, Slack, and perhaps others. That’s quite a year for IPOs.
Trading IPOs is nothing if not exciting – especially once the options are listed. That’s not to say that every IPO has multiple large magnitude moves after launching. But, IPOs where there’s no consensus agreement on the valuation can certainly have their share of volatility.
This often takes place with companies which aren’t earning profits but have spent a ton of money already (in expenses). When the stock price is based entirely on future potential, opinions will vary greatly. How do you price hype?
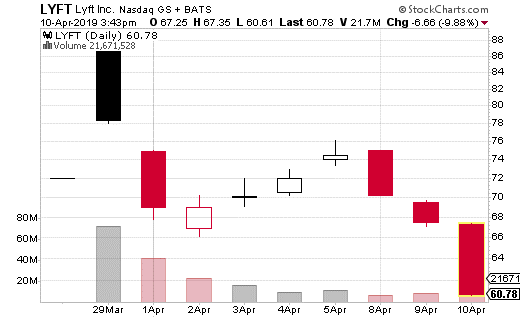
We’ve seen this situation play out with LYFT. The ride share company is one of two huge players in the space – the other one being Uber. The growth potential in the ride sharing space is vast. However, the company also has net losses of over $900 million.
LYFT’s IPO price was $72, and it quickly climbed to as high as $88 on the day of the launch. However, the hype didn’t take long to fade, and the stock price quickly dropped below the IPO price. As I write this, the share price is all the way down to about $61.
So, how do you trade a stock like Lyft with options? Can you take advantage of all the volatility? Is it worth the risk?
At least one options trader thinks so. This trader purchased a straddle in LYFT, which makes money if the stock moves far enough either up or down from the strike price. By the way, a straddle is simply buying a call and put at the same strike, in the same expiration.
In this case, the trader purchased the May 10th 68 straddle in Lyft, with the stock price right at $68. Most of the time, you’ll see the straddle purchased at the strike that is closest to the actual price of the underlying stock, also know as the at-the-money strike.
The cost of the straddle (the combination of the 68 call and put) was $9.53, which is certainly expensive. Of course, that’s what you’d expect from a stock that moves as much as Lyft has so far. The breakeven points for the trade are roughly $58.50 and $77.50. So, if the straddle moves beyond those points (and it’s currently already most of the way towards the lower the number) then the trade profits.
About 250 straddles were purchased, so each dollar above or beyond the breakeven points will generate $25,000 in profits. However, the trader paid over $250,000 for these straddles and that premium is at risk the closer the stock closes to $68 at expiration.
So – should you make a straddle trade in Lyft? Well, in this case, it looks like it was a successful gamble. You could still pay about $950 per straddle at whatever the current at-the-money strike is, but that’s clearly a lot of money to spend on one spread (strategy).
On the other hand, Lyft has been sufficiently volatile to justify the price of the straddle so far. I wouldn’t make a habit out of trade like this, but doing a small amount (like 1 or 2 straddles) in a situation like this will likely work out in the short-term. The risk is certainly high due to the cost, but the rewards may also be substantial.
For those curious, professional options traders may make a trade like this, but they’d hedge it with shares of LYFT. It’s a strategy called gamma scalping. It can work really well when there’s volatility, but can be costly and requires you to be at your screen for most of the trading day.
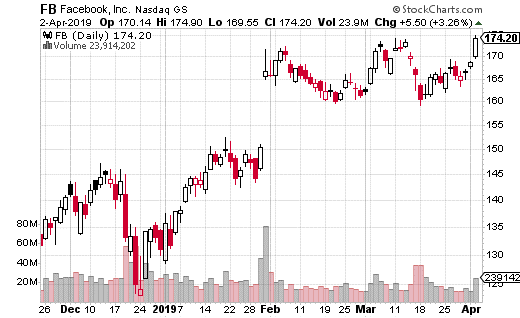
It’s undoubtedly been a good year for stocks, with the S&P 500 up almost 15% year-to-date. But, it’s been an even better year for the oft-embattled tech giant, Facebook (FB). Shares in the omnipresent social media company are up 33% so far this year.
FB has taken quite a beating over the last year on user privacy concerns and other regulatory issues. The company has dealt with issues ranging from not doing enough to curb election interference to promoting hate speech to selling user data to dubious third-party vendors. Moreover, there are growing calls by government officials to break up FB and its alleged monopoly power in the social media space.
Cleary, there has been plenty of bad news in recent months. As such, investors have to be pleased with the year-to-date results of FB stock taking everything into consideration. But, can the current bullish trend continue? And what about all the concerns from the previous year?
First off, I don’t think FB is in any real danger of getting broken up. I believe it would be very difficult to prove monopoly power for a company like Facebook, which technically has plenty of substitutes and competition out there.
On the other hand, other regulatory and privacy concerns are still an issue. FB is attempting to get in front of these issues (after months of criticism). However, the company still has a lot of work to do to improve the massive hit to its reputation.
Nevertheless, FB still has plenty of growth potential. That’s mostly because Instragram is still extremely popular, along with WhatsApp. Both platforms were acquired by Facebook and have continued to thrive and grow.
In fact, an analyst thinks Instragram’s new e-commerce service could produce $10 billion in revenues by 2021. That’s obviously music to the ears of current investors, who saw the shares gain over 3% when the analyst comment hit the wire.
Options action on FB has been plenty bullish as well. The last week of options activity has been roughly 70% bullish. Earnings are due during the first week of May, but many of the large trades I’ve seen expire in April. So, it wouldn’t be a shock to see the share price climb into next month’s earnings.
One trade in particular was about as bullish of a trade as is possible with options. This trade, called a risk reversal, has the strategist selling puts to finance a call purchase. Downside risk is precarious below the short put strike, but upside gain potential is enormous.
This particular trade expires April 18th and involved selling the 162.5 put and buying the 177.5 calls with the stock at about $174. The trade cost $1.42 and was executed about 1,000 times (for a total cost of about $150,000). That makes the breakeven point just below $179.
The 162.5 put was sold as a way to lower the price of the call, which would have cost nearly $2.00 without the proceeds from the short put. However, in return, the trader could lose $100,000 per $1 move below the put strike plus the premium cost of the trade.
Conversely, the trade generates $100,000 per $1 move above the breakeven point. By the way, that breakeven point of $179 is much closer to the price (about $174) than the short put strike. If FB closes in between the strikes at April expiration, the trade only loses the premium paid.
Still, this is clearly a very bullish trade over the next two weeks. There is quite a bit at stake using a risk reversal, so the trader clearly has a strong opinion on FB’s upside potential.
Now, most people shouldn’t mess with risk reversals, which are mostly used by professional traders. Instead, you can make a bullish trade on FB with limited risk over the same period by using a vertical call spread.
For instance a similar bullish trade for April 18th would be buying the 177.5 strike call and selling the 182.50 strike call. The trade only costs $1.25 and that’s all you are risking. The gains are capped at $3.75, which is still 300% return potential. That’s not bad for a trade with clearly defined and limited risk.