Category Archives: ETF

7 Best ETFs for Investors Wondering How to Start a Retirement Fund

Source: Shutterstock

Figuring out how to start a retirement fund can be a daunting task for any investor, but that is especially true for younger, novice investors that are nowhere near retirement age.

Investors wondering how to start a retirement fund do not need to scramble for ideas and vehicles to immediately start retirement planning. Easy-to-access instruments include 401k plans (for some workers) and individual retirement accounts (IRAs).

“You may want to think about opening an IRA in addition to or instead of a 401k plan if your employer doesn’t offer one. Even if you have a 401k, you may have more investment choices through an IRA,” according to Bank of America Merrill Lynch. “Whether you choose a Traditional or Roth IRA will depend largely on your income and age. (If you’re a small business owner, you may also be able to contribute to a small business IRA).”

For novice investors pondering how to start a retirement account, exchange-traded funds and mutual funds are excellent places to start for a number of reasons, including the ability to bolster portfolio diversification and access multiple asset classes.

With that in mind, here are a few ideas for investors wondering how to start a retirement fund.

ETFs for Starting a Retirement Fund

Vanguard Total Stock Market ETF (VTI)

Vanguard Total Stock Market ETF (VTI)

Expense Ratio: 0.04% per year, or $4 annually per $10,000 investment

Home to $101.8 billion in assets under management at the end of July, the Vanguard Total Stock Market ETF (NYSEARCA:VTI) is the third-largest U.S.-listed ETF by assets. Across its various share classes, the Vanguard Total Market Fund is one of the largest index funds in the world with nearly $726 billion in combined assets under management.

Not only that, but VTI is cheap. Really cheap. Its annual fee of just 0.04%, which makes it less expensive than 96% of competing funds, according to Vanguard data. Focusing on fees is an important factor for investors wondering how to start a retirement fund because when investing for the long-term, the more an investor saves on fees, the more his or her capital grows.

Another element investors pondering how to start a retirement account need to consider with equity investments is broad-based exposure. VTI delivers on that with a roster of more than 3,650 stocks, or more than seven times the number of components found in the S&P 500.

ETFs for Starting a Retirement Fund

iShares Core S&P U.S. Growth ETF (IUSG)

iShares Core S&P U.S. Growth ETF (IUSG)

Expense Ratio: 0.04%

Younger investors pondering how to start a retirement account should remember that they have the benefit of time, meaning some of their investments should be aggressive in nature. Growth stocks fit the bill as aggressive plays.

The iShares Core S&P U.S. Growth ETF (NASDAQ:IUSG) offers cost-effective exposure to a broad basket of domestic large- and mid-cap growth stocks. This $5.11 billion ETF, which turned 18 years old in July, tracks the S&P 900 Growth Index and holds 543 stocks.

Something else investors wondering how to start a retirement account should remember about growth strategies is that this investment factor typically leans toward the technology and consumer discretionary sectors. IUSG allocates nearly 57.50% of its combined weight to those sectors compared to just under 39% in the S&P 500.

ETFs for Starting a Retirement Fund

Invesco QQQ (QQQ)

Source: Shutterstock

Invesco QQQ (QQQ)

Expense Ratio: 0.20%

Keeping with the theme of younger investors being aggressive in the earlier stages of establishing retirement accounts, the Invesco QQQ (NASDAQ:QQQ) is a fund worthy of consideration.

QQQ, which tracks the Nasdaq-100 Index, is home to 103 stocks, nearly 61% of which are classified as growth stocks. And if the exposure to technology and consumer discretionary stocks in a typical growth fund is not enough, QQQ devotes over 82% of its roster to those two sectors.

QQQ is also an appropriate vehicle for investors looking for exposure to each of the FAANG stocks. Those five stocks combine for approximately 40% of the ETF’s weight.

ETFs for Starting a Retirement Fund

WisdomTree U.S. LargeCap Dividend Fund (DLN)

Source: Shutterstock

WisdomTree U.S. LargeCap Dividend Fund (DLN)

Expense Ratio: 0.28%

A frequently asked question when wondering how to start a retirement fund is how to generate income. Dividend-paying stocks are a key component of that equation and the WisdomTree U.S. LargeCap Dividend Fund (NYSEARCA:DLN) is one of the better dividend ETFs to consider.

DLN is not a yield-focused strategy, nor does it take into account for how many years a company has boosted its payout. Rather, the fund’s underlying index, “is dividend weighted annually to reflect the proportionate share of the aggregate cash dividends each component company is projected to pay in the coming year, based on the most recently declared dividend per share,” according to WisdomTree.

DLN’s expense ratio is higher than some of the legacy funds in this category, but DLN also warrants that fee because, over long holding periods, it has handily outperformed some of its cheaper rivals. The fund, which yields almost 2.50% on a trailing 12-month basis, allocates about 45% of its combined weight to the technology, financial services and healthcare sectors.

ETFs for Starting a Retirement Fund

Vanguard Intermediate-Term Corporate Bond ETF (VCIT)

Source: Shutterstock

Vanguard Intermediate-Term Corporate Bond ETF (VCIT)

Expense Ratio: 0.07%

Investors wondering how to start a retirement account should remember that diverse, effective retirement planning also includes some fixed income exposure. The Vanguard Intermediate-Term Corporate Bond ETF (NASDAQ:VCIT) can help with that.

Historically, investment-grade corporate bonds are not significantly more volatile than U.S. government debt, but corproates do offer a better income profile, making this an ideal, lower risk asset class for retirement-minded investors. VCIT holds over 1,700 bonds, but over a third of its portfolio comes via financial services issuers.

“The strategy’s five-year annualized return through June 2018 of 3.5% matched the category average. The portfolio’s low fee helped it produce the competitive return against its peers that dabble in higher-yielding junk bonds,” according to Morningstar.

ETFs for Starting a Retirement Fund

Invesco S&P SmallCap 600 Pure Value ETF (RZV)

Source: Shutterstock

Invesco S&P SmallCap 600 Pure Value ETF (RZV)

Expense Ratio: 0.35%

Historical data confirm that one of the most potent factor combinations is size and value. Novice investors pondering how to start a retirement fund should include small-cap and value stocks in that fund. The Invesco S&P SmallCap 600 Pure Value ETF (NYSEARCA:RZV) conveniently does that and has been one of the best-performing small-cap funds during the current bull market in U.S. stocks.

RZV tracks the S&P SmallCap 600 Pure Value Index and holds 165 stocks with an average market capitalization of just over $1 billion. Over longer holding periods, RZV has been less volatile than broader small-cap benchmarks, such as the Russell 2000 Index.

Although it is a value fund, RZV allocates over 35% of its weight to the consumer discretionary sector, a group often associated as a growth destination. Industrial and financial services names combine for over 28% of RZV’s weight.

Over the past three years, which were a trying time for value stocks, broadly speaking, RZV has outpaced the large-cap S&P 500 Value Index, by 320 basis points.

ETFs for Starting a Retirement Fund

How to Start a Retirement Fund: ProShares Investment Grade—Interest Rate Hedged (IGHG)

ProShares Investment Grade–Interest Rate Hedged (IGHG)

Expense Ratio: 0.30%

If you’re wondering how to build a retirement account in a rising interest rate environment, a newer breed of bond funds offer protection against Federal Reserve tightening cycles. The ProShares Investment Grade—Interest Rate Hedged (BATS:IGHG) was one of the first ETFs to offer income and rising rates protection under one umbrella.

IGHG has a minuscule net effective duration of 0.04 years and arrives at the reduced sensitivity to rising rates by “including a built-in hedge against rising rates that uses short positions in U.S. Treasury futures,” according to ProShares.

Traditionally, short-term bond funds mean less income as the trade-off for reduced rate risk, but that is not the case with IGHG. The ProShares fund offers a solid 30-day SEC yield of 4.04%, which is exceptional among rate-hedged and investment-grade bond funds.

As of this writing, Todd Shriber did not hold a position in any of the aforementioned securities.

Get up to 14 dividend paychecks per month from safe, reliable stocks with The Monthly Dividend Paycheck Calendar, an easy-to-use system that shows you which dividend stocks to pick, when to buy them, when you get paid your dividends, and how much.  All you have to do is buy the stocks you like and tell them where to send your dividend payments. For more information Click Here.

Buy These ETFs Setting Up Profits from a Strong Dollar

August – a month with many market participants on vacation – is well known for its bouts of volatility and markets in a tizzy about things not so important.

This year is holding to form with a selloff triggered by worries that turmoil in Turkey – mainly caused by a steep fall in its currency – will spill over into more important emerging markets and then eventually developed markets.

But as usual with August angst, it is much ado about nothing and it merely offers you an opportunity to pick up stocks on sale in some of the better emerging markets. More on that later. First, I want to give you a quick look at Turkey.

Turkey Tantrum

The crisis in Turkish markets was triggered by the geopolitical standoff between the U.S. and Turkey, or more specifically, its leader – President Recip Tayyip Erdogan.

A leader I might add that believes he knows better than the markets and has taken full control of the economy. Turkey needs much higher interest rates and tough austerity measures, but he will not hear of that. So he leads his country down the path of Venezuela toward economic oblivion.

Even with that said, the contagion effects emanating from Turkey are very limited. The sell-off we’ve seen in most other emerging markets is not justified by the fundamentals. First, Turkey is not a significant player in the global economy. Last year its GDP was $900 billion, or about 1% of global GDP at market exchange rates. And when it comes to foreign exposure to Turkish assets, the impact is equally limited. Non-residents hold 20% of Turkey’s equity market, which has a market capitalization less than 2% the size of the U.K. stock market. In terms of debt, foreigners hold about 40% of Turkish government bonds – and Turkey’s public debt is quite low, at only 30% of its GDP.

There’s been much talk about the exposure of certain European banks to Turkey. But even there, the exposure is quite limited. Of the Eurozone’s roughly €175bn claims on Turkish assets, Spanish banks have the largest exposure, with one of the country’s biggest, BBVA, having the most at risk. French and Italian banks are next, a very distant second. Korea barely slides into the top ten, and no other Asian country has any significant exposure to Turkey.

But what about those other emerging markets that the talking heads on CNBC (that know little about Ems) are worried about? The most exposed will be the countries that lack sound and coherent fiscal and economic policies. And there are several of those…

Brazil, faces a very contentious election this autumn and looks particularly at risk. South Africa has a highly respected finance minister and central bank, but faces doubts over its determination to stick to economic orthodoxy. Russia will be helped by the credibility its central bank gained through its handling of the 2014 rouble crisis, but is hampered by unpredictable U.S. sanctions policy. Another problem area is countries that have high non-bank dollar-denominated debt. And here Chile, Mexico and Malaysia all are worrisome.

But all of this does NOT mean that this is not a great time for you to invest into some other emerging markets.

Emerging Markets Are Fast-Growing, Cheap Markets

Especially since the Turkey tantrum has made them very cheap relative to a very expensive U.S. stock market without really changing their strong fundamental story.

According to the highly respected stock market research firm, Research Affiliates, the cyclically adjusted earnings multiple of the MSCI EM index is now 13.7, putting it in the 25th percentile. In other words, emerging stocks have been more expensive than they are now 75% of the time. In comparison, U.S. stocks trade at a cyclically adjusted multiple of 31.9, putting it in the 97th percentile. That means U.S. stocks have only been more expensive than now 3% of the time in history.

Let’s look too at some valuation metrics – price-to-book, price-to-sales, and price-to-earnings. For the U.S., the numbers are 3.3, 2.1 and 21.7 respectively. For Hong Kong, the numbers are 1.6, 2.1 and 14.2 respectively and for South Korea, the numbers are 1.0, 0.7 and 10.3 respectively. The markets that are relatively cheap are pretty obvious.

You may wonder why I’m emphasizing valuations measures? It’s because these measures, such as CAPE (cyclically adjusted price-to-earnings ratio), are often a good indicator of coming outperformance.

For example, the 10 cheapest stock markets at the end of 2016 returned an average of 29.5% in 2017. That outpaced the return from the 10 most expensive markets of 23.4% and the S&P 500 return of 21%. And the 10 cheapest stock markets at the end of 2015 returned 19% in 2016 while the 10 most expensive markets actually declined by 1%.

As far as economic growth goes, there is no comparison between developing countries like China and India when compared to developed nations like the U.S. The percentage increase (in dollar terms) for the GDP between 2002 and 2017 for China is 713% and for India, 398%. In comparison, the U.S. economy only grew by the same as Germany – 76%, and below Canada’s 118%.

And for stock market performances, there really is no comparison. For the G7 major economic powers, the average stock market gain over the period from 2002 has been nearly 200%. But if you look at the markets contained in the Shanghai Cooperation Organization countries – China, Russia, India, Pakistan and other smaller countries, the stock market gain has averaged about 1,500% in the same time period.

These are just some of the reasons I have always been an investor in emerging markets.

Where to Invest

I’ve already mentioned to you places in the developing world to avoid such as Turkey, Russia, South Africa, Brazil and Mexico. But what about the places where I would invest?

For that, you have to look at Asia. And here’s why…

For decades, the U.S. was far and away the biggest driver of growth in global GDP. But today, the lion’s share of global growth is coming from emerging Asia. Consider this data from the investment firm KKR

It says that the U.S. share of contribution to global real GDP will fall from 25% in the 1992 to 2000 period, to just 9% in the 2010 to 2020 period. Meanwhile, China’s contribution will jump from just 20% in the 1992 to 2000 period, to 34% in the 2010 to 2020 period. And for Asia as a whole, the number leaps from 43% in the 1992 to 2000 period to an impressive 62% in the 2010 to 2020 period.

That’s where I want to be as a long-term investor – where the growth is.

There a number of individual stocks that are and will continue to benefit from the economic growth across Asia. But for now, let me just cover broad ways to participate in that growth through ETFs.

The first ETF is one that I personally own – the WisdomTree China ex-State-Owned Enterprises Fund (Nasdaq: CXSE). The top three positions in the fund, comprising about a third of the portfolio, are the most well-known Chinese companies – Alibaba (NYSE: BABA), Tencent Holdings (OTC: TCEHY) and Ping An Insurance Group (OTC: PNGAY). With the recent selloff in China, the fund is down 19% year-to-date and 3% over the past year.

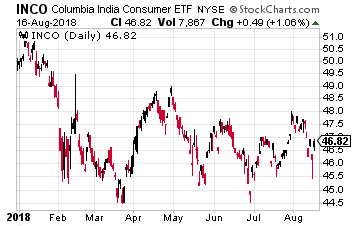
For India, an ETF to consider is the Columbia India Consumer ETF (NYSE: INCO). This is down 8% year-to-date, but is still up 7% over the last year. Its top three positions include local subsidiaries of well-known consumer brands – Nestle India and Hindustan Unilever. Number three is perhaps India’s best-known food company, Britannia Industries.

Buffett just went all-in on THIS new asset. Will you?
Buffett could see this new asset run 2,524% in 2018. And he's not the only one... Mark Cuban says "it's the most exciting thing I've ever seen." Mark Zuckerberg threw down $19 billion to get a piece... Bill Gates wagered $26 billion trying to control it...
What is it?
It's not gold, crypto or any mainstream investment. But these mega-billionaires have bet the farm it's about to be the most valuable asset on Earth. Wall Street and the financial media have no clue what's about to happen...And if you act fast, you could earn as much as 2,524% before the year is up.
Click here to find out what it is.

Source: Investors Alley

Buy These 5 High-Yielders from Someplace You Wouldn’t Expect

Driven by a strong economy worldwide and rising corporate confidence, global dividends in 2017 reached record levels. Payouts rose 7.7% last year – the fastest pace since 2014 – to $1.3 trillion.

Domestically, payout growth in the U.S. rebounded from a sluggish 2016 when election uncertainty caused companies to hold off their investment and dividend plans. The U.S. posted dividend growth of 6.3% last year compared with just 1.7% in 2016, he said, with a record $438.1 billion in payouts made to shareholders.

However, the star of the dividend show was Asia, according to a study conducted by asset manager Janus Henderson.

Asian Dividend Payouts Soar

Asia-Pacific companies grew their dividends the fastest, climbing by 12.7% in the 12 months to the end of May to a record $283.5 billion, out of a total of $936.8 billion for dividends generated in the rest of the world — dwarfing the growth rate of dividends elsewhere. Between 2009 and 2018, the value of annual dividends paid out by Asian companies tripled, while payouts from the rest of the world doubled in value, according to the study.

This just shows you how the world has changed in 10 years. Back then, many of Asia’s top businesses were growing quickly, but were not worried about paying income to their shareholders. That perception holds today among investors even though many Asian corporate managements have changed their attitudes towards dividends and now pay out generously.

The numbers back up that change in attitude. In 2017, Asia Pacific companies accounted for $1 for every $6 of the dividends paid worldwide, up from just over $1 in every $9 paid out in 2009. A big contributor has been China where dividends payments have grown from just $8 billion in 1998 to $111 billion in 2016.

I believe Asian stocks have more potential for long-term dividend growth than their U.S. counterparts for a number of reasons. Despite the trade war rhetoric, earnings growth among Asian companies has maintained the momentum that started in late 2016, which reversed a three-year trend of deflation and earnings declines for many companies. Asian companies have also weaned themselves from an over-reliance on debt, and today are less leveraged than those in the United States. And of course, the broader Asia growth story and rise of the consumer class is still alive and well.

Valuations among these companies are also far more attractive than they are in the U.S., thanks to U.S. fund selling driving down the prices of most Asian stocks. In other words, U.S. markets have already built huge earnings expectations into many stock prices and valuations are at historically high levels. By contrast, many Asian stocks have already had the worst case trade war scenario built into them.

How to Invest Into Asian Dividend Payers

If you are interested in capturing some of that dividend growth potential from Asian stocks, there are several ways to do it.

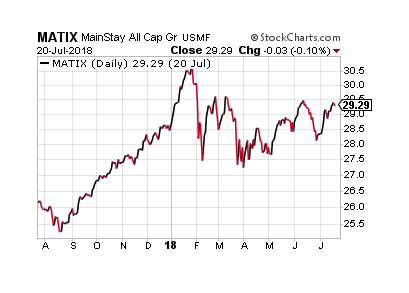
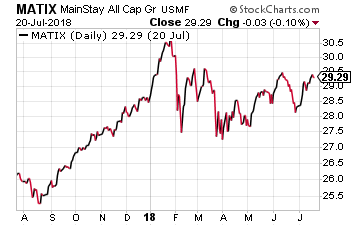
The first is an old-fashioned, but effective, way. You can buy a mutual fund from a company whose sole focus is Asia – the Mathew Asia Dividend Fund (MUTF: MATIX). Its top holdings include well-known blue chips such as Taiwan Semiconductor and HSBC.

But it also includes less well-known names to American investors including Shenzhou International Group Holdings, which is the largest knitwear manufacturer in China and makes clothing for Nike and others. Its stock soared an incredible 4200% over the past decade!

The next way for you to access Asian dividends is through exchange traded funds (ETFs). There are several that focus on Asian dividend payers, including the iShares Asia/Pacific Dividend ETF (NYSE: DVYA), the WisdomTree Asia Pacific ex-Japan Fund (NYSE: AXJL) and the O’Shares FTSE Asia Pacific Quality Dividend ETF (NYSE: OASI).

Some of these ETFs (WisdomTree) have familiar names such as Samsung Electronics, Taiwan Semiconductor and China Mobile in them. While others have more of an emphasis on bank and utility stocks. My personal preference would be to go with the ones that have the growth names in them in hopes of capturing a rising dividend stream.

Of course, the final option is to simply buy some of the high-dividend paying stocks such as China Mobile (NYSE: CHL), which listed on the New York Stock Exchange back on October 22, 1997. This stock used to be a high-flyer because of the rapid growth it enjoyed. But now the Chinese phone market is saturated and its stock performs like any other utility.

The company had a payout ratio of 48% in 2017. China Mobile had a final dividend payment of $0.20 per share for the year ended 31 December 2017. Together with the interim dividend payment of $0.21 per share, and a special dividend payment of $0.41 per share to celebrate the 20th anniversary of its IPO, the total dividend payment for the 2017 financial year amounted to $0.82 per share.

Its current yield is 4.66%, although that has been offset by that U.S. fund selling (trade war fears) that has sent the stock down almost 13% year-to-date. So if you’re going to buy the stock, do it piecemeal because the trade war winds are still blowing.

But once again, my preference would be to buy a broad-based fund or ETF that has a number of dividend-paying companies in the portfolio.

Buffett just went all-in on THIS new asset. Will you?
Buffett could see this new asset run 2,524% in 2018. And he's not the only one... Mark Cuban says "it's the most exciting thing I've ever seen." Mark Zuckerberg threw down $19 billion to get a piece... Bill Gates wagered $26 billion trying to control it...
What is it?
It's not gold, crypto or any mainstream investment. But these mega-billionaires have bet the farm it's about to be the most valuable asset on Earth. Wall Street and the financial media have no clue what's about to happen...And if you act fast, you could earn as much as 2,524% before the year is up.
Click here to find out what it is.

Source: Investors Alley 

3 High-Yield Dividend Funds Taking Advantage of Market Volatility

Outside of the FAANG bubble, to date in 2018 the U.S. stock market has trended sideways. As you may be aware, that sideways direction has been punctuated by large daily moves in both directions – up and down. Increased market volatility can produce more attractive return opportunities for covered call option traders. However, you don’t have to be an options trader to get a boost from your income stock portfolio based on the covered call strategy.

When you see the financial news media talking about market volatility or the VIX, those metrics are derived from options pricing on the S&P 500. When the market is volatile, option buyers will pay more, and option sellers ask for more to cover the risks of quickly changing share prices. The covered call strategy involves buying shares of a stock and then selling call options backed by the shares. The strategy produces cash income from the call options sales. A cap is put on the upside of potential share price gains, and the options provide a small cushion against a price drop. The covered call strategy is primarily an income producing strategy.

You don’t have to become an options trader to benefit from covered call selling. There are about two dozen closed-end funds that employ the strategy. When you invest in one of these CEFs, you will get exposure to the stock portfolio of the fund, plus an attractive dividend yield from the call selling employed by the fund managers. Here are three funds to consider.

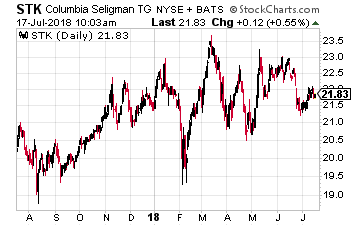
Columbia Seligman Premium Technology Growth Fund (NYSE: STK) seeks capital appreciation through investments in a portfolio of technology related equity securities and current income by employing an option writing strategy.

The fund’s investment program will consist primarily of investing in a portfolio of equity securities of technology and technology-related companies as well as writing call options on the NASDAQ 100 Index or its exchange-traded (ETF) fund equivalent on a month-to-month basis.

The aggregate notional amount of the call options will typically range from 25% to 90% of the underlying value of the fund’s holdings of common stock. Results have been excellent, with annualized returns of 18.4% and 20.9%, for the last three and five years, respectively.

STK currently yields 8.4%.

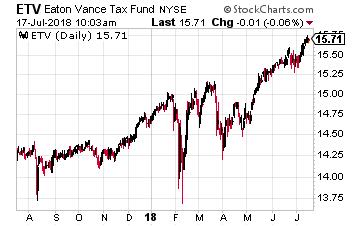
Eaton Vance Tax-Managed Buy-Write Opportunities Fund (NYSE: ETV) invests in a diversified portfolio of common stocks and writes call options on one or more U.S. indices on a substantial portion of the value of its common stock portfolio to generate current earnings from the option premium. Buy-Write is another name for covered call writing. Also, as the fund name states, the managers strive to generate the best after tax returns. The fund uses the S&P 500 stock index as its benchmark evaluate returns.

Three and five year average annual returns have been 11.0% and 13.25 percent respectively. To show that different managers will have their day, ETV is up 6.9% year to date, while STK has gained just 3.2%.

ETV pays monthly dividends and currently yields 8.5%.

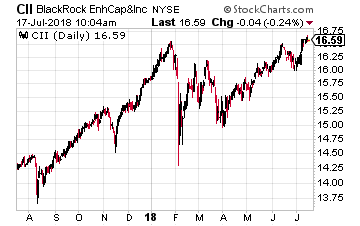
BlackRock Enhanced Capital & Income Fund (NYSE: CII) seeks to achieve its investment objective by investing in a portfolio of equity securities of U.S. and foreign issuers. The fund also employs a strategy of selling call and put options.

While the other two funds use index or ETF options for income, the BlackRock managers employ the writing of single stock options. Selling puts is a comparable strategy that can at times produce better returns compared to selling calls.

Three and five year annual returns for CII were 11.9% and 13.8%, respectively. The fund is up 5.25% year to date.

CII pays monthly dividends and yields 6.0%.

Get up to 14 dividend paychecks per month from safe, reliable stocks with The Monthly Dividend Paycheck Calendar, an easy-to-use system that shows you which dividend stocks to pick, when to buy them, when you get paid your dividends, and how much.  All you have to do is buy the stocks you like and tell them where to send your dividend payments. For more information Click Here.


Source: Investors Alley 

Are Options Traders Telling Us To Stay Away From Emerging Markets?

If you’ve been reading my articles regularly, you’ll know that I spend a lot of time talking about block trades.  These are the huge trades that show up on your options volume screeners, typically in increments of 1,000 or bigger.  They can be unusual volume in a normally lightly traded name, or they may be very big trades which occur in high volume names (such as index ETFs).

Options analysts like to look at block trades to see where the action is.  Usually very big trades are executed by traders with abundant capital.  Of course, lots of capital usually means access to copious amounts of research as well.  In other words, block trades are often done by people who have very good information.

Many times, the reasons behind these really big trades are easy to figure out.  Hey, someone bought 20,000 calls in Apple (NASDAQ: AAPL), it’s probably going up!  Or, sheesh, someone bought 50,000 puts in SPDR S&P 500 ETF (NYSE: SPY), it’s probably a hedge against a correction!

Other times, trying to figure out the purpose of a block trade can be a puzzle.  Sometimes, you never know what the traders are trying to accomplish.  It’s not like we are seeing the actual trading books of these traders… just one big trade at a particular point in time.

Still, there is a lot that can be gleaned from watching block trades, especially in stocks and ETFs which don’t trade that often.  They may give you an idea of where the underlying asset is headed or if volatility is going to pick up, among other things.

Here’s a very interesting block trade I came across this week…

The trade involved the purchase of over 20,000 puts on Invesco Emerging Markets Sovereign Debt ETF (NYSE: PCY).  Now, an emerging market debt fund may not sound all that interesting to you, but there are some very unusual factors to consider regarding this trade.

First off, PCY is a fund that buys government debt in emerging market countries.  It’s got about $4.5 billion in assets, making it the second largest ETF in this space.  However, the largest fund in the emerging market debt space is far bigger.  In fact, iShares JP Morgan USD Emerging Market Bond ETF (NASDAQ: EMB) has $12.5 billion in assets.

And that’s not all…

Not only is EMB the more popular fund, it’s also much more heavily traded.  Average daily options volume in EMB is about 10,500.  In PCY, the average is 8.  That’s right… 8 options per day.  When over 25,000 options trade in one day in an ETF that normally averages 8, it definitely draws attention.

In this case, it wasn’t actually one huge block trade, but several smaller blocks of the September 27 puts (with the stock around $27.25).  When you have a name like PCY which isn’t liquid in options, you may see the trade broken into many smaller parts to get it filled.  And sure enough, there were lots of pieces traded, from roughly 200-lots up to 1000, with prices ranging from around $0.60 to $0.80… mostly purchases.

This would lead us to believe the trader (or traders) think the ETF is going down by the end of the summer.  That in turn means there’s a fair amount of money (something like $1.5 million) betting that emerging market government bonds are going to take a hit in the coming weeks.  You can see form the chart that PCY has been on a sharp run higher the last week or so.

This leads to several questions….

If it’s a hedge against a downturn in emerging market debt, why not use the much more liquid EMB options?  For that matter, even from a speculation standpoint, you could probably get better fill prices on EMB options.  Their implied volatilities were about the same at the time of the trades, so it doesn’t seem to be a relative value proposition.

I can think of two reasonable explanations, although I’m sure there are others I’m not considering.  First off, the trade could have to do with the actual bond holdings of the particular ETFs. On the surface, it looks like PCY and EMB have similar exposure to countries and credit ratings groups. But, drilling down may show one has more or less exposure to a potential default candidate.

(For the bond nerds out there, EMB does have quite a bit shorter duration than PCY, but that’s probably not much of a difference maker.  Perhaps more importantly, EMB has over 400 bonds in its portfolio while PCY has just over 100.)

The other potential explanation is more nebulous.  Perhaps there’s something about the actual structure of the PCY ETF which is amiss.  It may be that someone very smart has figured out that given the structure of the bond portfolio, the ETF price should be lower than it is.  That’s not the sort of thing I can prove, but we should know by September if PCY drops more than EMB.

No matter the reason, it may not be a bad idea to take a flier on PCY puts, especially if you’re bearish on emerging market debt.  After all, we have all kinds of tariffs to consider which could hurt emerging market countries.  And, the debt problems in Italy could spill over into emerging market bonds as well.  For under $0.75 a put, it’s not a bad gamble to make for those looking at something a bit more speculative to trade.

  [FREE REPORT] Options Income Blueprint: 3 Proven Strategies to Earn More Cash Today Discover how to grab $577 to $2,175 every 7 days even if you have a small brokerage account or little experience... And it's as simple as using these 3 proven trading strategies for earning extra cash. They’re revealed in my new ebook, Options Income Blueprint: 3 Proven Strategies to Earn Extra Cash Today. You can get it right now absolutely FREE. Click here right now for your free copy and to start pulling in up to $2,175 in extra income every week.

A Quick 185% on an ETF That’s Just Now Bottomed

If you have any interest in economic policy, especially macroeconomic policy and repercussions, now is about as interesting as it gets. I realize most people don’t get a hoot about macroeconomics, but it can be very useful for analyzing trading opportunities. (For me, it goes beyond that since I have a degree in economics which focused heavily on the macro side of things.)

We’re experiencing a real life experiment on how tariffs and trade wars are bad for an interconnected global economy. Tariffs can gain political traction because they are supposed to create or protect domestic jobs. However, as soon as other countries imposed their own tariffs, it generally just comes back to bite the industries that initially were supposed to be insulated.

For a developed nation like the US, a trade war would probably result in something like a 3% decrease in GDP. That’s a big deal when you’re talking about trillions of dollars, but it’s also not catastrophic. On the other hand, tariffs can be extremely detrimental to the growth of emerging market economies.

iShares MSCI Emerging Markets ETF (NYSE: EEM) is an extremely popular ETF for trading a basket of emerging market stocks. The heavily traded EEM does almost 70 million shares per day in share volume plus 400,000 options on average.

As you can see from the chart below, emerging markets have taken a pretty big hit lately. EEM started trending down when tariffs became a major news item. Since the actual implementation of the tariffs, it has dropped even lower.

However, a massive options trade last week in EEM suggests that the ETF is done falling for the rest of the month. This trade, known as a put ratio spread, involved a 100,000 by 200,000 put spread – which is about as big of an options trade as you’ll ever see.

More specifically, a trader purchased the June 29th 42.5 puts 100,000 times (with the stock at $43.50) while simultaneously selling 200,000 of the 42 puts in the same expiration. Now, buying a put spread is normally a bearish strategy, but the trader actually collected a credit of $0.06.

That means if EEM stays where it is or moves up, the position will generate $600,000 in profit. The max gain is at $42 on expiration, where the trade would earn $0.56 or $5.6 million. However, below $42 in EEM is where the risk comes in. Every $1 below $42 would result in roughly $10 million in losses. Clearly, there’s big money betting on EEM staying above that level through the end of June.

I like the idea of this trade, but obviously not the risk involved. In fact, selling a put spread is tough in general because the options are so cheap. I think you may be better off betting on a reversal straight up using a call spread.

For instance, with EEM at just under $44, you could buy about a month of time and get the July 20th 44-46 call spread for about $0.70. Break even is $44.70, you can make $1.30, and max risk is just the $0.70 you pay in premium. That’s a very reasonable amount to pay for a month-long trade that has 185% max gain upside.

  [FREE REPORT] Options Income Blueprint: 3 Proven Strategies to Earn More Cash Today Discover how to grab $577 to $2,175 every 7 days even if you have a small brokerage account or little experience... And it's as simple as using these 3 proven trading strategies for earning extra cash. They’re revealed in my new ebook, Options Income Blueprint: 3 Proven Strategies to Earn Extra Cash Today. You can get it right now absolutely FREE. Click here right now for your free copy and to start pulling in up to $2,175 in extra income every week.

2 Robotics Industry ETFs Tapping into Expanding AI and Automation

The two ETFs I like are the Global X Funds Robotics & Artificial Intelligence ETF (Nasdaq: BOTZ) and the ROBO Global Robotics & Automation Index ETF (Nasdaq: ROBO). I am very positive on both of these ETFs and have previously recommended them to investors.

As you might surmise, there are a lot of similarities between the two funds as they both focus on what we might generally call robotics and automation.

But there are subtle differences. ROBO is older with an inception date of 10-22-2013, while BOTZ came to market on 09-12-2016. BOTZ is more liquid than ROBO with 88.9 million shares outstanding and an average trading volume of about two million shares a day. That compares with ROBO’s 53 million shares outstanding and average daily trading volume in the range of 700,000 shares.

BOTZ does have an edge when it comes to expenses with a lower expense ratio than ROBO – 0.68% versus 0.95% – which factors into the long-term performance of any fund or ETF.

Portfolio Differences

Most important, of course, when comparing the two ETFs is the difference in their portfolios. And here BOTZ has a more concentrated portfolio with only 29 stocks versus the 93 stocks in the ROBO portfolio. That will likely make it somewhat more volatile and risky.

Related: Buy This Robotics Stock Before the Machines Take Over

If you look at the geographic exposure of the two funds – with my preference for exposure to the leaders in the industry, which are Japanese – here BOTZ has the upper hand with about 50% of the fund in Japanese stocks versus only 28% for ROBO.

However, when it comes down to the actual stocks in the portfolios, both are outstanding. That’s why I’m adding both to our own portfolio. Here are the top 10 positions for each ETF:

Top 10 Positions for the Global X Robotics & Artificial Intelligence ETF

  1. Nvidia
  2. Yaskawa Electric (Japan)
  3. Fanuc Corporation (Japan)
  4. Keyence Corporation (Japan)
  5. Intuitive Surgical
  6. Mitsubishi Electric (Japan)
  7. ABB Ltd. (Europe)
  8. SMC Corporation (Japan)
  9. Daifuku Company Ltd. (Japan)
  10. Omron Corporation (Japan)


Top 10 Positions for the ROBO Global Robotics & Automation Index ETF

  1. iRobot
  2. Daifuku Company Ltd. (Japan)
  3. IPG Photonics
  4. Nabtesco Corporation (Japan)
  5. Hiwin Technologies (Taiwan)
  6. Yaskawa Electric (Japan)
  7. Fanuc Corporation (Japan)
  8. Intuitive Surgical
  9. Mazor Robotics
  10. Oceaneering International

Over the past year, BOTZ returned 27% while ROBO gained 21%, both easily outperforming the S&P 500 index. As you can see they were both on a tear and shot up too fast right before the February correction. They’ve since dropped back down in what one might call consolidation. With the bright future I see for the robotics industry, I expect the outperformance to start again and to continue for many years.

3 Tech Stocks That Could Go to 2,524%!

Don’t risk your money on IPOs, risky tech startups… or the next Pets.com, Snapchat, Groupon, Webvan hyped by the financial media as the next big thing… all of them black holes for investors’ hard earned money. Instead, bank on these 3 high-growth tech stocks that offer a high likelihood of outperformance in the near-term, and a chance of TRIPLING – even quadrupling – before the end of the year!

Buffett just went all-in on THIS new asset. Will you?
Buffett could see this new asset run 2,524% in 2018. And he's not the only one... Mark Cuban says "it's the most exciting thing I've ever seen." Mark Zuckerberg threw down $19 billion to get a piece... Bill Gates wagered $26 billion trying to control it...
What is it?
It's not gold, crypto or any mainstream investment. But these mega-billionaires have bet the farm it's about to be the most valuable asset on Earth. Wall Street and the financial media have no clue what's about to happen...And if you act fast, you could earn as much as 2,524% before the year is up.
Click here to find out what it is.

The 10 Best ETFs of February 2018

February was a crazy month for investors; consequently, the landscape of best-performing exchange-traded funds expanded from primarily biotech and emerging-market ETFs in January to several other spaces for this edition of the best ETFs of the month.

In February, the fortitude of those with generally bullish outlooks was tested as the Dow Jones Industrial Average made historic 1,000-plus point drops twice in less than two weeks. Meanwhile, the S&P 500 is down more than 4% on the month.

The turmoil is mostly attributed to anticipation of a rise in interest rates based on expectations of inflation in the months ahead. But outside of these struggles, some ETFs still managed to maintain impressive performances, while others managed to step up and replace old champions.

In no particular order, here are the best ETFs of February, excluding leveraged funds and exchange-traded notes.

Best ETFs of February: ProShares Long Online/Short Stores ETF (CLIX)

Best ETFs of February: ProShares Long Online/Short Stores ETF (CLIX)

Source: Shutterstock

Expense Ratio: 0.65%
YTD Performance: 18% vs 2% for the S&P 500

Among the best ETFs of February were several retail-based ETFs. Notably, the ProShares Long Online/Short Stores ETF (NYSEARCA:CLIX) manged to stand out from the crowd, as it has significantly outperformed the S&P 500 in 2018 so far.

This recently founded ProShares ETF is distinct in that it has a multifaceted strategy that aims to take full advantage of the death of traditional retail while also focusing on the rise of internet retailers. The CLIX achieves this by shorting traditional retail stocks and simultaneously holding online retailers with significant growth. As such, its holdings are constantly varying.

In simplest terms, the long/short approach of this ETF means investors “benefit from both outperforming online and underperforming physical retailers.”

Best ETFs of February: Loncar Cancer Immunotherapy ETF (CNCR)

Best ETFs of February: Loncar Cancer Immunotherapy ETF (CNCR)

Source: Shutterstock

Expense Ratio: 0.79%
YTD Performance: 23%

Last month, the Loncar Cancer Immunotherapy ETF (NASDAQ:CNCR) made it on the list of best-performing ETFs and it continued its success in February with an impressive 20% advantage over the S&P.

For those who are unfamiliar with CNCR, it’s a biotech ETF that emphasizes companies that are involved with cancer research and treatment.

More specifically, CNCR’s holdings must have cancer immunotherapy drugs that are approved by the FDA or EMA, are in human testing stages, are about to enter human testing stages and/or are involved with other companies that focus on immunotherapy. This includes companies like Aduro BioTech Inc (NASDAQ:ADRO) and AstraZeneca plc (ADR) (NYSE:AZN), which are among its top 10 holdings.

Best ETFs of February: Franklin FTSE Brazil ETF (FLBR)

Expense Ratio: 0.19%
YTD Performance: 14%

Although some new names made the list of best ETFs of February, Brazilian emerging market ETFs like Franklin FTSE Brazil ETF (NYSEARCA:FLBR) still performed exceptionally well this month.

The FLBR follows the FTSE Brazil Capped Index, which emphasizes the most notable large- and mid-cap companies in the country. Although investing in emerging markets like Brazil carries significant risks, top holdings like iron producer Vale SA (ADR) (NYSE:VALE) and brewing company Ambev SA (ADR) (NYSE:ABEV) give investors access to tons of growth potential in a less familiar marketplace.

Best ETFs of February: Global X Social Media ETF (SOCL)

Expense Ratio: 0.65%
YTD Performance: 12%

Global X Social Media ETF (NASDAQ:SOCL) does exactly as its name suggests — it gives investors exposure to social media companies from across the world. As such, it isn’t your run-of-the-mill tech ETF. And the fact that it has outpaced the S&P 500 places it among the best ETFs of 2018 so far.

The SOCL ETF does hold U.S. social media names like Twitter Inc (NYSE:TWTR) and Snap Inc(NYSE:SNAP), but it also holds international social media stocks like Russian internet technology company Yandex NV (NASDAQ:YNDX) and Chinese internet-based holding company Tencent Holdings Ltd (OTCMKTS:TCEHY).

Best ETFs of February: iShares MSCI Brazil Capped ETF (EWZ)

Best ETFs of February: iShares MSCI Brazil Capped ETF (EWZ)

Source: Shutterstock

Expense Ratio: 0.62%
YTD Performance: 14%

As with last month, another Brazilian-based ETF — iShares MSCI Brazil Index (ETF)(NYSEARCA:EWZ) — managed to out-do the competition and it remains one of the best ETFs of 2018 so far.

This ETF isn’t significantly different from the FLBR, but as emphasized on last month’s list, EWZ is more focused — it has less holdings — and it has a significantly longer track record of success than relative newcomer FLBR. However, depending on how you look at it, the FLBR could have the upper hand since it has a lower expense ratio at 0.19% compared to the EWZ’s 0.62%.

Ultimately, whichever ETF you focus on, Brazil remains one of the hottest emerging markets out there, and both funds have demonstrated significant staying power in 2018.

Best ETFs of February: Amplify Online Retail ETF (IBUY)

Best ETFs of February: Amplify Online Retail ETF (IBUY)

Source: Shutterstock

Expense Ratio: 0.65%
YTD Performance: 13%

The Amplify Online Retail ETF (NASDAQ:IBUY) is another retail ETF that has managed to beat the competition at the start of the year and become one of the best-performing ETFs.

Unlike the CLIX, the IBUY does not feature a short/long approach; however, it distinguishes itself by focusing on both traditional retail names that are converting to a primarily online format and online e-tailers that should experience significant growth in the years ahead. This gives investors a basket of stocks with known-name brands like Lands’ End, Inc. (NASDAQ:LE) and online up-and-comer Shutterfly, Inc. (NASDAQ:SFLY).

Best ETFs of February: PowerShares NASDAQ Internet ETF (PNQI)

Best ETFs of February: PowerShares NASDAQ Internet ETF (PNQI)

Source: Shutterstock

Expense Ratio: 0.6%
YTD Performance: 15%

Although many biotech ETFs were among the best performing last month, many tech/internet-based ETFs have manged to hold strong through February’s volatility. The PowerShares Exchange-Traded Fund Trust (NASDAQ:PNQI) is no exception, as it has out-paced the S&P 500 by more that 12%.

The PNQI tracks the NASDAQ Internet Index, which contains the “largest and most liquid U.S.-listed companies engaged in internet-related businesses.” In plain English, that means the ETF contains major tech names like Netflix, Inc. (NASDAQ:NFLX), Amazon and Chinese internet search provider Baidu Inc (ADR) (NASDAQ:BIDU).

It might not have countless obscure tech names with mega-ton growth potential, but it does contain many of the top players with more than 90% of its holdings allocated to mostly large-cap stocks that focus on internet software & services and internet & direct marketing retail. This makes it a fairly reliable fund for those who have faith in the consistently strong tech space.

Best ETFs of February:  iShares MSCI Russia Capped ETF (ERUS)

Best ETFs of February:  iShares MSCI Russia Capped ETF (ERUS)

Source: Shutterstock

Expense Ratio: 0.62%
YTD Performance: 13%

Although it didn’t make an appearance on last month’s list, Russia was a notable emerging market in February, as seen in the standout performance in the iShares MSCI iShares MSCI Russia ETF (NYSEARCA:ERUS).

While U.S. stocks were generally struggling to hold their ground, the ERUS manged to gain a 12% lead over the S&P. As with all emerging markets, there is tons of growth potential packed in, but with that comes significant risk. But investors who are willing to look past these risks (as well as the “us versus them” political landscape), might find what they’re looking for in this fund.

The ERUS tracks a wide variety of Russian stocks like financial Sberbank of Russia(OTCMKTS:AKSJF) and gas pipeline operator Gazprom PAO (ADR) (OTCMKTS:OGZPY), most of which are likely unfamiliar to U.S.-based investors.

Best ETFs of February: iShares Latin America 40 ETF (ILF)

Best ETFs of February: iShares Latin America 40 ETF (ILF)

Source: Shutterstock

Expense Ratio: 0.49%
YTD Performance: 12%

As mentioned earlier, several emerging-market ETFs retained their spot on the list of best ETFs for the month, and that includes the iShares S&P Latin America 40 Index (ETF)(NYSEARCA:ILF).

Although several of the ETFs on this list emphasize Brazil, the ILF will be appealing to those looking for generalized exposure to the best that the Latin American marketplace has to offer. There’s still an impressive allocation to Brazilian stocks with this ETF (60%), but other Latin American countries — Mexico (23%) and Chile (12%) — have a significant presence.

As such, its top holdings include companies like Brazilian energy play Petroleo Brasileiro SA Petrobras (ADR) (NYSE:PBR), telcom America Movil SAB de CV (ADR) (NYSE:AMX) and Mexican holding company Fomento Economico Mexicano SAB (ADR) (NYSE:FMX).

Best ETFs of February: KraneShares CSI China Internet ETF (KWEB)

Best ETFs of February: KraneShares CSI China Internet ETF (KWEB)

Source: Shutterstock

Expense Ratio: 0.72%
YTD Performance: 9%

The KraneShares CSI China Internet ETF (NYSEARCA:KWEB) embodies a combination of two trends that the best ETFs of the month followed: it’s an emerging-market ETF with an emphasis on internet-based companies.

Specifically, the KWEB focuses on “China-based companies whose primary business or businesses are in the internet and internet-related sectors.” What that all boils down to is a large sector breakdown in tech (60%) and consumer discretionary (37%) stocks, with the remainder allocated to industrial companies (2.5%).

The fund’s heavy emphasis on Chinese large-cap (55.7%) and mid-cap (35.4%) companies leads to top holdings like the “Chinese Amazon” Alibaba Group Holding Ltd (NYSE:BABA), JD.Com Inc(ADR) (NASDAQ:JD) and Weibo Corp (ADR) (NASDAQ:WB).

Get up to 14 dividend paychecks per month from safe, reliable stocks with The Monthly Dividend Paycheck Calendar, an easy-to-use system that shows you which dividend stocks to pick, when to buy them, when you get paid your dividends, and how much.  All you have to do is buy the stocks you like and tell them where to send your dividend payments. For more information Click Here.


Source: Investors Place

It’s Time to Go Long on This ETF While the Rest of the Market Panics

Let’s talk about big, long-term trends.

You know, those relentless economic and technological movements that promise to endure, no matter what’s happening in the stock market.

I’m talking about things that we can’t live without – like water or electricity – as well as fast-developing socio-economic trends like the shift towards greater use of robotics and automation.

I bring this up today because – as was inevitable – the markets are experiencing a sudden bout of serious volatility.

Following a whipping at the end of last week, the major indexes suffered a bloodbath to kick off this week, with the Dow shedding 1,175 points on Monday. It was the index’s biggest one-day points loss in history and the strong start to 2018 has been wiped out in the blink of an eye.

If you’re prone to panic… don’t.

Such volatility is something I’ve forewarned about a few times in recent articles – and I’ve given you a variety of investments to consider that are well-positioned to weather such storms.

But I’ve also highlighted companies that aren’t just defensive. They’re ones that should rise over the long term regardless – and are capitalizing on the robotics trend that I mentioned above.

These Two ‘Bots Are Rising

Specifically, I’m referring to ABB Ltd. (NYSE: ABB), which I profiled on November 30, and Brooks Automation(Nasdaq: BRKS), which I wrote about on December 14. Both stocks are up since I wrote about them.

As I noted in my original ABB piece, almost one-third of the firm’s annual sales come from its robotics business. And Frost & Sullivan recently recognized its prowess in this area with the 2017 Global Company of the Year Award for innovation in automation systems. The award was based on ABB’s industry-leading work in the Distributed Control Systems (DCS) industry. ABB connects 70 million smart devices via 70,000 automated control systems.

With Brooks, the company reported strong fiscal first-quarter earnings last week, with revenue totaling $189.3 million – up 18% over Q1 2017. Non-GAAP net income also rose by 35% over Q1 2017 to $35 million. That resulted in $0.32 EPS – up 25% and beating estimates by a penny.

For the current quarter, revenue is projected to hit $195 million to 205 million, with EPS between $0.33 and $0.41.

On a wider industry scale, the verdict is clear: The robotics and automation trend is growing. Fast.

  • The International Data Corp (IDC) projects robotics spending to surge to $230.7 billion in the five-year period to 2021 – with a CAGR of 22.8%.
  • The International Federation of Robots (IFR) says 1.3 million industrial robots will enter the global factory “workforce” this year. The figure will rise to 1.7 million by 2020.
  • The IFR projects even bigger growth for the service robot industry, with 32 million units in operation between this year and 2020. That will bring the market value to $11.7 billion.

As John Santagate, research manager at IDC Manufacturing Insights’ Supply Chain, says, “We continue to see strong demand for robotics across a wide range of industries.”

And as technology and innovation improves, the reach is spreading beyond just industrial and manufacturing, too. Dr. Jing Bing Zhang, research director at IDC Manufacturing Insights’ Robotics division, says. “The convergence of robotics, artificial intelligence, and machine learning are driving the development of the next generation of intelligent robots for industrial, commercial, and consumer applications. Robots with innovative capabilities such as ease of use, self-diagnosis, zero downtime, learning and adaptation, and cognitive interaction are emerging and driving wider adoption of robotics and enabling new uses in healthcare, insurance, education, and retail.”

He’s right. Growth here will continue for years to come – and I’m still positive on ABB and Brooks.

The past week’s market downturn also gives you a great chance to buy another investment on the cheap.

Go Robo

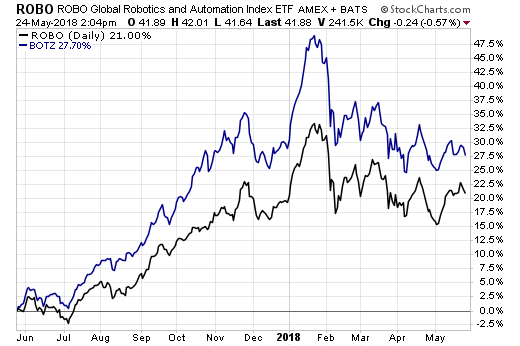
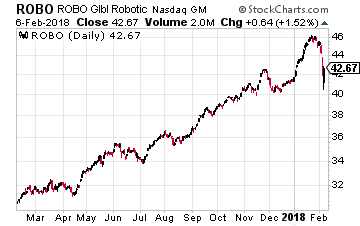
With volatility currently cranking higher, if you’re looking for a more diversified way to play this trend, take a look at the ROBO Global Robotics and Automation ETF (Nasdaq: ROBO).

Launched in October 2013, the actively managed fund (which includes both investment managers and industry experts) was the first to track global robotics, automation, and AI. It holds 89 stocks – including stalwarts like iRobot (Nasdaq: IRBT)and Rockwell Automation (NYSE: ROK) – with the $2.4 billion in assets divided equally among them.

In a testament to the strength of the industry, ROBO is coming off a stellar 2017, in which it gained 40%. It’s up 68% since inception.

With “lots of people looking at what’s going to happen over the next 5, 10, 20 years,” according to Global X Funds director of research Jay Jacobs, the robotics and automation trend is most definitely one place they’re looking. And as the industries continue to expand, heavily diversified funds like ROBO are right in the sweet spot of the growth.

Not only that, the market’s current downturn means you can buy shares for around 8.5% cheaper than a couple of weeks ago.

Buffett just went all-in on THIS new asset. Will you?
Buffett could see this new asset run 2,524% in 2018. And he's not the only one... Mark Cuban says "it's the most exciting thing I've ever seen." Mark Zuckerberg threw down $19 billion to get a piece... Bill Gates wagered $26 billion trying to control it...
What is it?
It's not gold, crypto or any mainstream investment. But these mega-billionaires have bet the farm it's about to be the most valuable asset on Earth. Wall Street and the financial media have no clue what's about to happen...And if you act fast, you could earn as much as 2,524% before the year is up.
Click here to find out what it is.

Source: Investors Alley

3 Buy Signals for This Hated Sector

It seems like investors were writing off the real estate sector entirely.

With the rise of technology used to shop online, work from home and even go to school, real estate has been a hated sector.

But it’s a sector I have been a fan of this year, triggering gains of 15% and 17% in my Pure Income service.

That’s because even though I know the landscape for real estate is changing, I still see the crowds at the malls, the wait times at restaurants and the continued need for hospitals and health care facilities.

So the decline in values recently has looked like an opportunity to me.

But my personal experience or viewpoint doesn’t have anything to do with my recommendation today.

 Instead, three separate computer-based buy signals are flashing bullish signals on the real estate sector, and I have a possible triple-digit opportunity for you.


Let me explain.

Three Buy Signals for the Real Estate Sector

Let’s start with the three buy signals on the sector before I give you the opportunity.

The first is the most basic, a price chart of the SPDR Real Estate Select Sector ETF (NYSE: XLRE).

Three separate computer-based buy signals are flashing bullish signals on the hated real estate sector, and I have a possible triple-digit opportunity.

This is showing a possible breakout of a long trend channel.

It may have just had a false breakout, since the price jumped above the trendline, then fell back below it. But this can also hold as a new, steeper uptrend for the exchange-traded fund (ETF). As long as it can hold above its previous peak, around $33.50, prices should continue to climb.

The second is a seasonality chart.

Three separate computer-based buy signals are flashing bullish signals on the hated real estate sector, and I have a possible triple-digit opportunity.

Right now, it is a great time to enter the real estate sector based on a 10-year seasonal analysis of the Vanguard REIT ETF (NYSE: VNQ). I used this ETF because it has data going farther back that the newly listed XLRE in the price chart.

December is clearly the strongest month to be in real estate, and we just bought a real estate investment trust (REIT) in my seasonal service, Automatic Profits Alert, a couple of weeks ago that is already benefiting from this trend.

The third chart is something you may not be too familiar with, but it is a concept I have discussed before called a Relative Rotation Graph™.

If you want to learn more about the concept, you can click here to read more about it.

Basically, it’s the idea that stocks rotate in and out of leading and lagging the market. And there are key turning points, where a sector will shift from lagging, to improving and eventually leading the market.

The real estate sector is at such a point. Take a look:

Three separate computer-based buy signals are flashing bullish signals on the hated real estate sector, and I have a possible triple-digit opportunity.

If you can read the text, you’ll notice it is in the lagging section of the chart. But when an ETF is in that section and turns sharply higher, like XLRE did, that is a sign momentum is shifting and the sector is turning around — which is the exact time we want to jump in.

A Unique Way to Profit

All told, the real estate sector is a solid buy right now.

In my service, I handpick certain stocks to benefit from these trends. For today, I’m going to recommend a unique way to profit, and that’s to buy a call option on the XLRE real estate ETF.

The option we are going to buy is the February 16, 2018, $34 call option.

With this option, we are expecting the ETF to rise as predicted by the three charts above. However, whenever you buy an option, it’s important to remember you can lose everything you paid to buy the option. Even though we have three buy signals, there’s always a chance the trade doesn’t work out, so just keep that in mind.

This option costs roughly $0.55, depending on when you purchase it. Since one contract covers 100 shares, one contract will cost about $55.

Now, I want to highlight that this is not a position that I will be tracking or updating you on, so it will be up to you to pull the trigger to take profits or cut losses.

A good rule of thumb for a trade like this is to sell half of your position at a 50% gain, and manage the second half to either take profits if it begins to fall by about 30% in value, or start to sell the second half once it is above 100%.

For a loss, you can cut it if it falls to a 50% loss.

For the ETF, all we need is it to rise about 4.2% over the next three months to hand us a 100% gain.

Regards,

Chad Shoop, CMT

In this exciting NEW VIDEO, Wall Street legend and former multibillion hedge fund manager Paul Mampilly pulls back the curtain on the biggest investment opportunity in the market today. What insiders are calling “The Greatest Innovation in History,” this revolution will mint more millionaires and billions than any technology that came before it. Right now, the current market for this technology is just $235 billion, but given how fast this technology is moving experts predict it will soar to $19 trillion by 2020. But 8,000% growth is just the beginning—and now’s your chance to get in on the action. [CONTINUE TO VIDEO]

Source: Banyan Hill