All posts by Jay Soloff

Jay Soloff is an options analyst with Investors Alley. Jay was previously the Chief Options Strategist at Hyperion Financial Group where he was the editor for over six years of several successful options newsletters. Prior to joining the online investment world, Jay was a floor trader and market maker on the CBOE, the world's largest options exchange. His experience includes trading a multi-million dollar options portfolio in equities options as well as serving as a consultant to Wall Street options trading groups. Jay also spent time as a senior analyst at a hedge fund of funds, where he analyzed professional options funds as well as traded option strategies for hedging purposes. All told, Jay has 20 years of options trading experience. He received his undergrad degree in Economics at the University of Illinois - Champaign, and his MBA and Master of Science in Information Management from Arizona State University.

How To Profit From One Trader’s Large Bet The Market is Crashing

Predicting where the stock market is going is a tricky business. Very few investors or traders have a consistent, strong track record when it comes to guessing the short- to medium-term direction of the market. That’s because there’s always plenty of noise in the short-term.

While there aren’t any obvious events this year (like an election) which could move the market, there are always plenty of unexpected occurrences which can change investor perception. The biggest potential catalyst in the coming months is probably North Korea. However, investors are already starting to write off the rhetoric involved in the situation.

Of course, you can’t ignore interest rates and upcoming Fed meetings. However, the market feels a December rate hike is all we’ll see this year, and Yellen’s Fed has been pretty transparent. Most likely, the Fed isn’t going to offer any major surprises for the balance of 2017.

On the other hand, the choice of a new Fed Chair could disrupt the markets somewhat if an interest rate hawk is brought on board. A more aggressive approach to raising rates could certainly impact stock prices. However, at this time we don’t have any idea who the next Chair will be and if that person will even be confirmed by the Senate.

Other than political events, which tend to only have short-term impact on stock prices, the only big changes in market direction could come from economic news. Particularly, if there are economic surprises, stocks may react more than expected.

This is primarily only a factor with major reports like monthly jobs, GDP, or inflation numbers. Lately, economic news has been pretty much on target, and there’s no reason to believe it will change significantly. Clearly, the hurricane damage will factor into jobs numbers, but economists will likely have taken those changes into account.

Here’s the thing…

Options traders have a better chance at making consistently successfully trades because they don’t typically have to pick a direction to make money. They can place high probability trades (selling options) which make money if stocks stay in a trading range or move sideways.

In fact, a pretty massive range-bound options trade was just made last week in the SPDR S&P 500 ETF (NYSE: SPY). SPY is the most heavily traded ETF in the world and tracks the S&P 500 index, a common proxy of the overall market. This particular trade was an options strangle, where the trader sold an out-of-the-money call and put at the same time, in the same expiration period (but at different strikes).

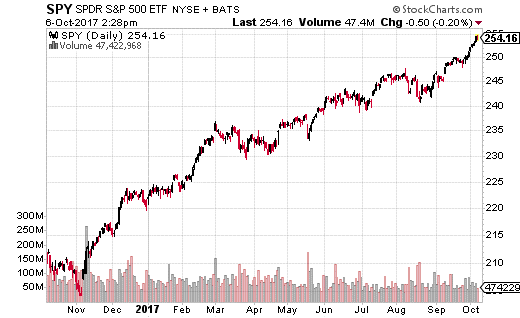
The short strangle consisted of selling the December 15th 263 calls and 237 puts. The credit received for the strangle was $1.64, and it traded about 21,000 times. That means the trader collected over $3.4 million in premium as a credit, and will keep all of it if SPY stays between $237 and $263 by December expiration.

Breakeven points for this trade are around $235 and $265. With SPY at roughly $254 at the time of the trade, the trader has more cushion to the downside ($19 down compared to $11 to the upside). Clearly the trader is less worried about upside for the remainder of the year.

Once again, there’s not much expected to occur between now and December which could roil the markets significantly. Of course you never know, which is why I’d recommend a very different trade than this. Frankly, selling strangles isn’t the sort of thing most traders should be doing. Leave that sort of strategy to the big institutions and professionals.

Instead, buying a straddle (buying the call and put at the same strike, at the same time, in the same expiration) could be a profitable strategy while also not in direct opposition to the short SPY strangle we just discussed. You see, a large stock index like the S&P 500 could easily sit within the range of the short strangle, but an individual sector could see a lot more movement.

One such sector is consumer staples. The Consumer Staples Select SPDR Fund (NYSE: XLP) is sitting right at the 200-day moving average, and could easily be much higher or lower by December 15th. Plus, the December 15th 54 straddle (buying the 54 call and put) is trading for less than $2.

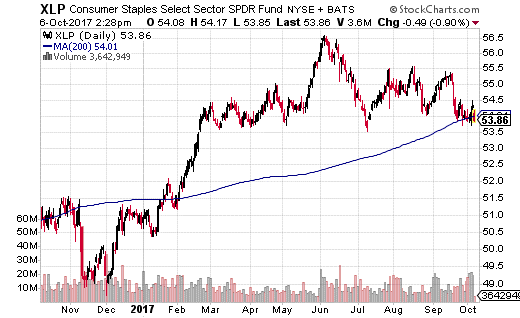
XLP would only need to go to $52 or $56 in the next 10 weeks or so to make money. That seems like a very achievable goal with so much time left before expiration.

  [FREE REPORT] Options Income Blueprint: 3 Proven Strategies to Earn More Cash Today Discover how to grab $577 to $2,175 every 7 days even if you have a small brokerage account or little experience... And it's as simple as using these 3 proven trading strategies for earning extra cash. They’re revealed in my new ebook, Options Income Blueprint: 3 Proven Strategies to Earn Extra Cash Today. You can get it right now absolutely FREE. Click here right now for your free copy and to start pulling in up to $2,175 in extra income every week.

Source: Investors Alley

Make This Trade For Astronomical Profits

Watching stock market volatility has become quite interesting the last few weeks. I’m not talking about watching the actual day-to-day VIX moves, they’ve mostly been boring. Instead, I’m referring to how the VIX has been moving in relation to what’s going on in the world.

In other words, I find investors’ reaction to major world news items to be… quizzical. There simply doesn’t seem to be a lot going on, well, anywhere, which is cause for concern among stock investors.

At first, it seemed like the nuclear threat from North Korea was going to be a source of higher VIX levels for the foreseeable future. However, traders soon brushed off the harsh rhetoric between the US and North Korea. And, even threat of nuclear war is barely moving the needle in the VIX.

Granted, it could just be that most experts believe the only solution to dealing with North Korea is a diplomatic one. Still, you’d think even the tiniest threat of nuclear annihilation would strike a chord with investors. But fear, it seems, is at a minimum these days.

At least part of the reason volatility remains lower than expected is due to the rampant amount of volatility selling taking place. I’ve mentioned this before, but selling volatility is typically a highly successful strategy. And, it’s become a major source of yield for many traders.

Shorting the VIX is just part of it though. Actual, realized volatility has also been at its lowest levels in recent history. It’s not just the options traders who aren’t concerned – stock buyers (and sellers) are simply not moving the market very much either. It’s been the case for much of 2017.

Still, volatility can become a factor in a hurry. We know from the Financial Crisis of 2008-2009 just how high and fast the VIX can move. It’s never a good idea to totally ignore volatility.  There’s nothing wrong with selling it to make money, but be darn sure you’re ready to buy it if things get dicey.

One massive trader is not convinced volatility will remain low the rest of the year. This trader made a massive bet on higher VIX levels back in the summer – and just recently rolled the enormous trade (originally set to expire in October) to December.

The trade itself is a call ratio spread financed with short puts. More specifically, the trader bought the VIX December 15 call versus two of the December 25 calls, while also selling the December 12 put. The trade was executed for a $0.20 debit, but the trader received a $0.20 credit when setting up the original October trade. In other words, this entire spread was basically done for even.

The really interesting part of this trade is just how huge it was in terms of number of contracts. The call spread was 260,000 by 520,000 contracts, with the puts also selling 260,000 times. That’s a crazy amount of options. If you include the closing/rolling of the October spread, there were 2.1 million options traded in this one gigantic trade – the highest in recorded history.

So what’s the trade mean?

Well, the strategy breaks even with the VIX between 12 and 15 on December expiration. It’s a winner from 15 up 35, with peak gains at 25. Finally, it’s a loser under 12 or above 35. Essentially, it’s a huge bet on higher volatility, or a relatively cheap way to hedge a massive stock portfolio. (By the way, peak gains would be about $250 million.)

As always, if you’re interested in betting on higher volatility or hedging your own portfolios with VIX, there are simpler ways to do so. One example is the December VIX 15-20 call spread, which can be bought for $0.75. Breakeven is at $15.75 and you can earn $4.25 max gain if the VIX spikes to 20 or above at December expiration. That’s over a 5 to 1 payout to risk ratio, which makes it a very cheap way to get long volatility if it spikes higher by the end of the year.

  [FREE REPORT] Options Income Blueprint: 3 Proven Strategies to Earn More Cash Today Discover how to grab $577 to $2,175 every 7 days even if you have a small brokerage account or little experience... And it's as simple as using these 3 proven trading strategies for earning extra cash. They’re revealed in my new ebook, Options Income Blueprint: 3 Proven Strategies to Earn Extra Cash Today. You can get it right now absolutely FREE. Click here right now for your free copy and to start pulling in up to $2,175 in extra income every week.

Source: Investors Alley

Quick Profits from Renewed Interest in Solar Stocks

Is solar power becoming a lucrative investment again? It seems like solar energy companies have taken a backseat to other, more exciting tech companies over the past few years. However, new energy policies may shift solar back into the… well… light of day.

Currently, solar power only provides about 1% of electricity in the US. However, it is by far the fastest growing major energy source in the country. As technology improves, it is very possible solar (and wind) power could replace fossil fuels as the leading source of electricity generation in the US in the next 10-15 years.

Here’s the thing…

What’s really got solar power investors excited these days is the potential for a tariff to be imposed on imported solar panels. The current administration believes cheap solar panels from foreign countries are hurting the effectiveness of US-based solar companies. As such, a tax on imported panels is being widely discussed as a way to improve domestic competition in the space.

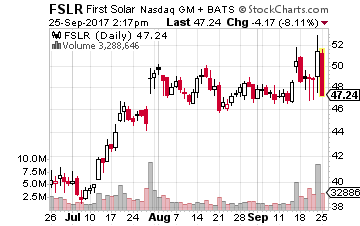
Whether you believe in the use of tariffs or not, one certain consequence of a solar tariff is sales of US manufactured panels will increase. That’s why stock investors are snapping up shares in companies like First Solar (NASDAQ: FSLR), the largest solar company in the US.

As you can see from the chart, FSLR jumped over 5% on the news of a possible solar tariff. Like with many manufactured products, domestic solar companies have trouble competing with panels and other solar tech created in cheap labor nations, like China. Clearly, these companies would benefit from an import tax.

It’s also clear that stock investors believe the benefits of a solar tariff will aid companies like First Solar. But what do options traders think?

Apparently, options traders are not nearly so keen on FSLR’s upside as stock traders. On the same day the stock was up over 5%, 60% of the options trades in FSLR were bearish. In fact, the largest trade of the day was someone purchasing 3,000 October 20th 47.50 puts for $0.92.

That means, with the stock around $51, a trader dropped $275,000 to bet FSLR would be back below roughly $46.50 in the next month. That’s the level the stock was at before any of this tariff talk was taking place.

Why would options traders be so bearish on what appears to be good news for FSLR? First off, options traders can often be contrarian. They tend to take a more measured, longer-term approach to trade theories. While the idea of a tariff sounds good for US solar companies, who knows if and when it will be enacted. Remember the infrastructure spending promises?

My guess is the options crowd is fading the rumor, while the stock crowd is eager to front-run the situation. As an options guy, I normally side with the options traders, but who knows in this case. The stock may dip back down if there’s no movement on the tariff in the next week or so. However, if the tariff talk gains steam, the stock may keep going up.

The one thing I do believe is FSLR is highly unlikely to be sitting at $51 by October 20th expiration. And that’s why I like the idea of buying an options strangle trade here. For $350 you could grab one 50-52 strangle (buying both the 50 put and 52 call at the same time), which breaks even around $46.50 or $55.50.

Either breakeven level is plausible to get to within the next month. And, you don’t even have to guess who’s right between the stock traders and options traders.

  [FREE REPORT] Options Income Blueprint: 3 Proven Strategies to Earn More Cash Today Discover how to grab $577 to $2,175 every 7 days even if you have a small brokerage account or little experience... And it's as simple as using these 3 proven trading strategies for earning extra cash. They’re revealed in my new ebook, Options Income Blueprint: 3 Proven Strategies to Earn Extra Cash Today. You can get it right now absolutely FREE. Click here right now for your free copy and to start pulling in up to $2,175 in extra income every week.

How to Trade Facebook (FB) With Options

Death, taxes, and Facebook (NASDAQ: FB) user growth… it should be the new saying. Social media giant Facebook continues to grow its user base quarter after quarter with almost military-like discipline. It seems like the only thing that could halt the growth is the limited population of the planet. Eventually, FB will run out of users, but does it even really matter once you have an audience of over 2 billion people to market to?

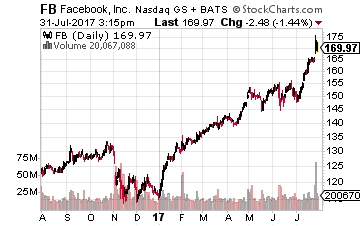
More importantly, user growth is clearly resulting in robust ad revenues. Last quarter, FB generated $9.2 billion in ad revenue, 87% coming from mobile ads. Quarter over quarter, FB’s monthly active users jumped 3.4% to over 2 billion. Daily active users came in at 1.3 billion – a stunning amount of people if you think about it. Remember, that’s daily users. No wonder FB’s ad platform is so dang popular.

What’s more, earnings far exceeded Wall Street’s expectations, coming in at $3.9 billion or $1.32 per share. Analysts had expected a $1.13 EPS. By the way, that profit number was even bigger than Alphabet’s (NASDAQ: GOOGL) this past quarter.

But here’s the thing…

Despite overall amazing numbers this past quarter, there is one weak link in FB’s impressive armor. Ad revenue growth is slowing. There simply isn’t enough real estate on mobile devices to offer any more ads. And, ads in the website’s timeline (the main spot for news and info) are already maxed out. While it’s really through no fault of Facebook, it’s a big deal for a company which generates the vast majority of its revenue through ad sales.

However, as you can clearly see in the chart, investors don’t seem in the last bit concerned about FB’s ad space dilemma. After earnings, the stock shot up to new highs. Yes, FB did post excellent numbers, but investors also tend to be very forward looking.

Fortunately for FB, management is also very forward looking. Mark Zuckerberg and the executive team realized a long time ago in order to continue growing, the company was going to have to diversify its revenue sources. That’s the reason they shelled out big bucks for products like Instagram and WhatsApp.

While FB’s legacy product may be running out of ad space, there is still plenty of opportunity with the company’s other products. WhatsApp has a user base of one billion users and sports 250 million daily users to boot. Instagram has 700 million users. Moreover, FB will soon be rolling out an enterprise messaging product to compete with Slack. Business software is a whole new realm of potential revenues.

As such, it doesn’t seem like FB is going to run out of new revenue channels anytime soon. Obviously, investors agree, judging by the buying occurring post earnings. So, what’s the best way for options traders to trade FB?

If you are a fan of FB but are concerned about buying the stock after a big run up, one strategy you could use is selling cash secured puts. By selling a put at the price you want to buy the stock at, you can earn income while you wait for the stock to pull back to your price. (Keep in mind, you need to have enough money in your account to cover owning 100 shares of the stock per options contract.)

For example, let’s say you’d like to purchase FB shares at $165, about $7 lower than where we are at the time of this writing. September 15th 165 puts could be sold for about $2.25. That means you’d collect $225 per contract in premium by selling the put.

If FB doesn’t drop below $165 by expiration, you get to keep the money and simply repeat the process (selling another put expiring in a month or two). However, if the stock does drop below the strike, you’ll get assigned the shares on expiration, thus getting long at the price you want. Either way you win. That’s why cash secured puts can be a great way to get long a stock at the price you desire.

An Options Trade That Wins No Matter What Direction Gold Moves

Over the next several weeks, investors will be heavily focused on any news or data which could impact the timing of future interest rate increases. Almost nothing moves the financial markets like major interest rate news.

For a change, we could have new market-moving info on our hands for the first time in many months.

You see, the Fed originally had a plan to increase rates three times in 2017. Their thought was the growing U.S. economy could sustain three small rate increases. The purpose behind these increases is to keep inflation from increasing too high or too quickly. (Two of the three increases have already happened.)

However, recent economic data suggest inflation isn’t of any real concern right now. In fact, it may even be too low (a topic which always sparks a ton of debate).

The key is, the Fed wants to avoid deflation at all costs, even at the risk of inflation rising too quickly. So, with inflation concerns shelved for the moment, the Fed may not have a reason to raise rates just yet. It’s even possible we won’t see another rate hike in 2017.

As you can imagine, whether or not the Fed raises rates again in 2017 is a big deal to short-term investors. That’s why every bit of news from the Fed and any major economic news will be analyzed ad nauseam for clues on when the next hike may occur.

Here’s the thing…

The timing of the next rate increase could have a major impact on the price of gold. As an alternative currency, gold prices will move quite a bit based on what US interest rates do. As such, there’s reason to believe gold could be more volatile in the coming weeks (and maybe months).

At least one big trader believes gold miners could be impacted heavily all the way until next year. Of course, gold miners move pretty consistently with gold prices. And, this trader just spent a pile of cash betting miners as a group will be far away from current levels by this time next year.

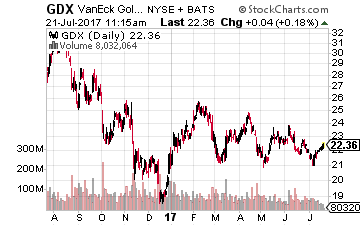
More specifically, the trader purchased a large strangle in the VanEck Vectors Gold Miners ETF (NYSE: GDX) expiring in June of 2018. A strangle consists of an out-of-the-money call and out-of-the-money put purchased simultaneously in the same expiration period. In this case, with the ETF at just over $22, the buyer purchased the 18 put and the 30 call. That’s a very wide strangle for such a low underlying price. In fact, with the cost of the trade at around $1.50 per strangle break-even points are all the way at around $16.50 and $31.50.

The strangle buyer clearly believes the next year is going to be volatile for gold and gold miners. The trader purchased 9,300 strangles, so is spending nearly $1.5 million on this trade. In other words, this is no idle bet.

Given what’s going on with interest rates, it doesn’t surprise me that at least one big trader is betting things are going to get interesting with gold over the next year. However, if you believe gold is going to move, you could take a more direct and shorter-term approach.

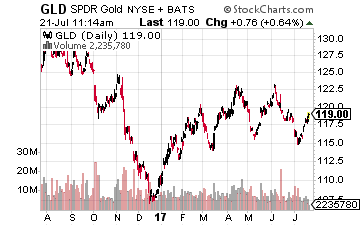
For example, the SPDR Gold Shares ETF (NYSE: GLD) looks like it could easily be on the verge of a big move either direction. This direct play on the price of gold could also be a good choice if you believe the precious metal is going to move in the next several weeks instead of months.

As of this writing, you could purchase the September 1st (of this year) 116.50-119.50 strangle in GLD for about $2.00. That’s bit more expensive than the GDX strangle from earlier, but it’s far closer to the money. Break even points would be at $114.50 and $121.50 – both very reachable levels in the next month if any economic surprises occur.