Trump’s Trade War Set to Cost This Automaker $1 Billion: Sell Now

If you like a good war, you’re living in the right era.

You don’t have to look far before you hear about a war on something.

War on crime. War on drugs. And outright war itself.

Now we’re facing another one.

News that the United States will slap a 25% tariff on steel imports and 10% on aluminum imports has triggered fears of a global trade war.

European Commission President Jean-Claude Juncker set the tone by saying that the EU will be forced to retaliate to the “stupid process” by imposing tariffs of its own on exported U.S. goods. “We can also do stupid. We have to be this stupid,” as he put it.

Adding duty to such crucial raw materials from abroad should bode well for U.S. steel and aluminum manufacturers – and their respective workforces. But it will also reduce global supplies and consequently push up prices for end users. In turn, those costs will be passed down to consumers.

When you think of the amount of steel and aluminum used in products, many sectors and industries will suffer. Chief among them are ones like construction and transportation.

Indeed, the auto industry accounted for over one-quarter of U.S. steel demand last year, according to Statista. And the American International Automobile Dealers Association has already said the tariffs will result in higher car prices and lower sales.

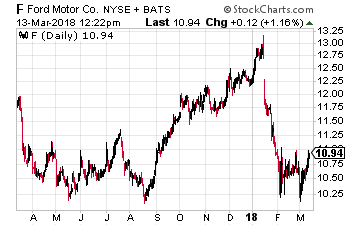
That’s bad news for big, multinational U.S. automakers like Ford Motor Co. (NYSE: F).

Speed Bumps Ahead for Ford

Right off the bat, the stock is down 11.3% year-to-date. But the losses extend further back than that. Since July 2014, shares have tumbled steadily, falling 39%.

Other recent developments don’t bode well, either.

Sales Down: Nationwide, total auto sales fell by 2% in 2017. And while overall year-over-year sales were up 1% in January, Ford didn’t join the party, with sales down 6.6%. The climate got worse in February, with total nationwide sales dropping by 2% and Ford’s sales slumping by 6.8%. A 12.3% plunge in higher-end SUV sales marked the fall. Some analysts feel auto sales peaked in 2017. The fact that Ford’s shares still didn’t rise as a result back then – and its sales are now lagging significantly – is an ominous sign.

Interest Up: Another red flag is the fact that the price of a new car rose by 2% in February, to $35,444, according to Kelley Blue Book. Not only that, interest rates on car payments (both new purchases and leases) are rising, too. Edmunds says the APR averaged 5.2% in February – up from 4.9% a year ago and from 4.4% in February 2013. They’re now at the highest levels since 2010. Rising car prices and interest rates aren’t exactly a good combination for automobile manufacturers trying to boost sales numbers.

As if this climate weren’t challenging enough, Ford and other conventional automakers are also facing pressure from the increasing shift towards ride-sharing and electric cars.

And now, in addition to these headwinds, is the specter of trade tariffs. UBS says higher raw materials prices could cost Ford an extra $300 million this year, with Goldman Sachs warning it could hit the company’s operating profit by $1 billion. Keep in mind, Ford’s operating margin isn’t great anyway – just 4.3%.

Add it all up, and you’ve got a nasty cocktail for Ford: Falling auto sales, higher sales prices, rising interest rates on car payments that’s deterring consumers from new purchases, the shift towards ride-sharing and electric cars, plus steel and aluminum tariffs adding to retail prices.

Oh, and a stock that’s gone nowhere but down for almost four years now.

Give Ford a wide berth.

Buffett just went all-in on THIS new asset. Will you?
Buffett could see this new asset run 2,524% in 2018. And he's not the only one... Mark Cuban says "it's the most exciting thing I've ever seen." Mark Zuckerberg threw down $19 billion to get a piece... Bill Gates wagered $26 billion trying to control it...
What is it?
It's not gold, crypto or any mainstream investment. But these mega-billionaires have bet the farm it's about to be the most valuable asset on Earth. Wall Street and the financial media have no clue what's about to happen...And if you act fast, you could earn as much as 2,524% before the year is up.
Click here to find out what it is.

Source: Investors Alley

This Math Is Magic


Dear Early Investor,

Last week, I told you about how adding a technical analysis layer to my stock vetting made me a much better investor.

This week, I’m going to share with you how I do it.

Of course, I can’t tell you everything in one short article. My partner Adam has already discussed a neat technical analysis tool called the relative strength index. Read his piece here if you haven’t already. It’s definitely worth a few minutes of your time.

Today, I’ll be discussing another neat tool: Fibonacci retracements.

It’s not the only tool I use. In fact, Fibonacci is most effective when used with other technical indicators. But it’s definitely one I like a lot.

For one, it’s versatile. It can help predict the extent of both pullbacks and rallies.

So what exactly are Fibonacci retracements?

They’re ratios that indicate when price reversals may be drawing near.

What this means is when a price line hits these levels, it signals a possible turnaround. When other technical indicators also point to a turnaround at the same time, the signal is amplified.

The most common Fibonacci ratios are 23.6%, 38.2% and 61.8%. (You’ll also see a 50% level with most Fibonacci charts – though technically, it’s not a part of the Fibonacci sequence.)

Curious as to where these ratios come from?

Well, we have to go back nearly a thousand years to identify their origins.

Leonardo Pisano Bigollo (aka Fibonacci) was a mathematician from Pisa who introduced the Fibonacci sequence to the West in the 12th century. It is as follows: 0, 1, 1, 2, 3, 5, 8, 13, 21, 34, 55, 89, 144, 233, 377, 610… and so on to infinity.

Fibonacci demonstrated how a number divided by the previous number in his sequence approximates 1.618. And, lo and behold, a number divided by the next highest number approximates 0.6180.

It’s known as the “golden ratio,” and it is the ratio I consider the most important. (By the way, the inverse of 1.618 is approximately 0.618!)

What I find fascinating is that these ratios are also found throughout nature, architecture, art and biology. They can be seen in everything from sunflowers to the spirals in galaxies.

The next most significant number? It’s 0.3820.

It’s the number you get when you take one of Fibonacci’s sequence numbers and divide it by another one two places higher. For example: 13/34 = .382. (Also note that 1 – .618 = .382.)

Years ago, I used these ratios for stock price analysis. Now I’m back at it, using them to help predict crypto price movements. It’s like meeting an old friend!

They’re called retracement levels (or ratios) because they refer to price movements that retrace in the opposite direction of a previous leg up or down.

As the bounce or correction approaches these retracement levels, technical analysts become increasingly aware of a possible price reversal, especially when other indicators are chiming in.

To illustrate just how Fibonacci works, I’m going to show you three bitcoin charts. For purposes of clarity, I’m not including other technical indicators, so keep in mind these charts have been simplified to an extent.

After a long climb, bitcoin finally peaked last December and began retracing some of the gains it previously made.

But by how much?

Remember, I said that 61.8% was the level I paid most attention to. You’ll notice in the chart that once prices broke below that important level, they immediately began a new leg up.

What can you do with this information?

When others may be thinking of selling, you’re thinking of buying on the dip. At the very least, it prevents you from selling at the wrong time.

Here’s another bitcoin chart using the Fibonacci levels from earlier, identifying a smaller leg up from last September…

As prices approach the 61.8% level, the possibility of a price reversal once again presents itself.

And another buying opportunity is indicated in advance using the Fibonacci levels.

So what about right now?

What can the Fibonacci levels tell us about current price movements?

With prices just shy of the 61.8% level, they say that a rally could be imminent.

A couple of things to remember here…

While Fibonacci puts me on the alert for a price reversal, I like to see it actually happening before issuing a buy or sell alert. And, as I’ve said, I like to see other indicators supporting what Fibonacci is telling me.

As I mentioned last week, we’re dealing in probabilities here, not certainties. So even though I now have a technical system in place (I call it the “Cadillac of technical analysis systems”) telling me how much lower prices need to go for an upswing to occur, there are no guarantees.

Nonetheless, these kinds of technical analysis tools go a long way in helping me understand price trends and manage risk.

We’now better equipped to give our members insightful buy and sell guidance so they can optimize gains, minimize losses and, at the end of the day, show greater overall crypto profits.

Soon, in our Crypto Asset Strategies service, we’ll focus much more on using technical analysis like this to help us vet new crypto recommendations. If this kind of approach interests you, be sure to keep a close eye on our upcoming alerts.

Good investing,

Andy Gordon
Co-Founder, Early Investing

The 145 Companies Your Stockbroker Will NEVER Tell You About Did you know more than 145 tiny companies have grown to $1 billion-plus valuations since 2012? SpaceX  is up 26,309% in value... Dropbox 31,733%... and Pinterest 487,404%. All of these 145 businesses started out as private companies your broker would have NEVER told you about. But now there’s a great way to find the next private companies poised for hyper-growth. Full Details Here.

Source: Early Investing