Are Options Traders Telling Us To Stay Away From Emerging Markets?

If you’ve been reading my articles regularly, you’ll know that I spend a lot of time talking about block trades.  These are the huge trades that show up on your options volume screeners, typically in increments of 1,000 or bigger.  They can be unusual volume in a normally lightly traded name, or they may be very big trades which occur in high volume names (such as index ETFs).

Options analysts like to look at block trades to see where the action is.  Usually very big trades are executed by traders with abundant capital.  Of course, lots of capital usually means access to copious amounts of research as well.  In other words, block trades are often done by people who have very good information.

Many times, the reasons behind these really big trades are easy to figure out.  Hey, someone bought 20,000 calls in Apple (NASDAQ: AAPL), it’s probably going up!  Or, sheesh, someone bought 50,000 puts in SPDR S&P 500 ETF (NYSE: SPY), it’s probably a hedge against a correction!

Other times, trying to figure out the purpose of a block trade can be a puzzle.  Sometimes, you never know what the traders are trying to accomplish.  It’s not like we are seeing the actual trading books of these traders… just one big trade at a particular point in time.

Still, there is a lot that can be gleaned from watching block trades, especially in stocks and ETFs which don’t trade that often.  They may give you an idea of where the underlying asset is headed or if volatility is going to pick up, among other things.

Here’s a very interesting block trade I came across this week…

The trade involved the purchase of over 20,000 puts on Invesco Emerging Markets Sovereign Debt ETF (NYSE: PCY).  Now, an emerging market debt fund may not sound all that interesting to you, but there are some very unusual factors to consider regarding this trade.

First off, PCY is a fund that buys government debt in emerging market countries.  It’s got about $4.5 billion in assets, making it the second largest ETF in this space.  However, the largest fund in the emerging market debt space is far bigger.  In fact, iShares JP Morgan USD Emerging Market Bond ETF (NASDAQ: EMB) has $12.5 billion in assets.

And that’s not all…

Not only is EMB the more popular fund, it’s also much more heavily traded.  Average daily options volume in EMB is about 10,500.  In PCY, the average is 8.  That’s right… 8 options per day.  When over 25,000 options trade in one day in an ETF that normally averages 8, it definitely draws attention.

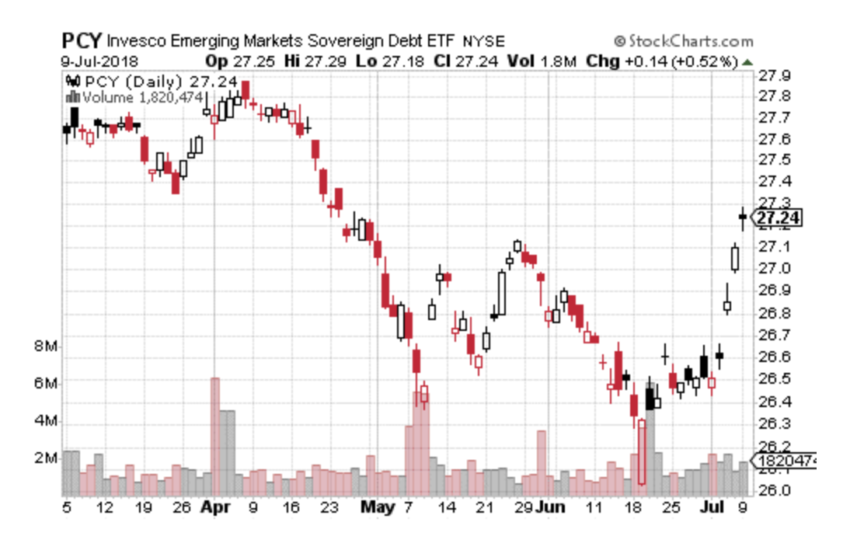
In this case, it wasn’t actually one huge block trade, but several smaller blocks of the September 27 puts (with the stock around $27.25).  When you have a name like PCY which isn’t liquid in options, you may see the trade broken into many smaller parts to get it filled.  And sure enough, there were lots of pieces traded, from roughly 200-lots up to 1000, with prices ranging from around $0.60 to $0.80… mostly purchases.

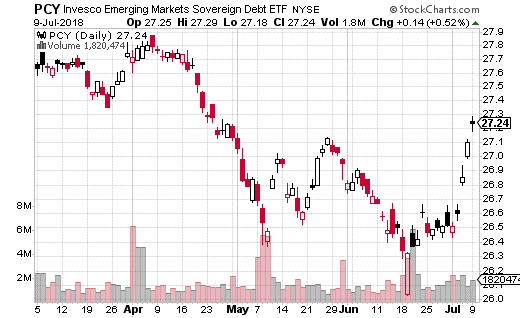
This would lead us to believe the trader (or traders) think the ETF is going down by the end of the summer.  That in turn means there’s a fair amount of money (something like $1.5 million) betting that emerging market government bonds are going to take a hit in the coming weeks.  You can see form the chart that PCY has been on a sharp run higher the last week or so.

This leads to several questions….

If it’s a hedge against a downturn in emerging market debt, why not use the much more liquid EMB options?  For that matter, even from a speculation standpoint, you could probably get better fill prices on EMB options.  Their implied volatilities were about the same at the time of the trades, so it doesn’t seem to be a relative value proposition.

I can think of two reasonable explanations, although I’m sure there are others I’m not considering.  First off, the trade could have to do with the actual bond holdings of the particular ETFs. On the surface, it looks like PCY and EMB have similar exposure to countries and credit ratings groups. But, drilling down may show one has more or less exposure to a potential default candidate.

(For the bond nerds out there, EMB does have quite a bit shorter duration than PCY, but that’s probably not much of a difference maker.  Perhaps more importantly, EMB has over 400 bonds in its portfolio while PCY has just over 100.)

The other potential explanation is more nebulous.  Perhaps there’s something about the actual structure of the PCY ETF which is amiss.  It may be that someone very smart has figured out that given the structure of the bond portfolio, the ETF price should be lower than it is.  That’s not the sort of thing I can prove, but we should know by September if PCY drops more than EMB.

No matter the reason, it may not be a bad idea to take a flier on PCY puts, especially if you’re bearish on emerging market debt.  After all, we have all kinds of tariffs to consider which could hurt emerging market countries.  And, the debt problems in Italy could spill over into emerging market bonds as well.  For under $0.75 a put, it’s not a bad gamble to make for those looking at something a bit more speculative to trade.

  [FREE REPORT] Options Income Blueprint: 3 Proven Strategies to Earn More Cash Today Discover how to grab $577 to $2,175 every 7 days even if you have a small brokerage account or little experience... And it's as simple as using these 3 proven trading strategies for earning extra cash. They’re revealed in my new ebook, Options Income Blueprint: 3 Proven Strategies to Earn Extra Cash Today. You can get it right now absolutely FREE. Click here right now for your free copy and to start pulling in up to $2,175 in extra income every week.

1 Click to Boost Your Dividend Income 59%

It’s a question I get from investors all the time: “Should I take my dividends in cash or reinvest them through a dividend reinvestment plan (DRIP)?”

My answer: unless you want your cash sitting in your account earning zero, your best bet is to reinvest any dividend money you don’t need to pay your bills.

But we don’t want to practice “buy and hope” investing, either, whether we do it through obsolete DRIPs or the old-fashioned way.

When I say “buy and hope,” I mean putting your cash into household names like the so-called Dividend Aristocrats and “hoping” for higher stock prices when you cash out in retirement.

You’ve probably heard of the 53 stocks on the Aristocrats list, which have raised their payouts for at least 25 straight years. Trouble is, despite their lofty name, these companies hand us a pathetic current dividend of 2.2%, on average.

And many pay a lot less:

5 Dividend Paupers

So if you invest mainly in these stocks (as many people do), you won’t have to worry about reinvesting your dividends. You’ll need every penny of dividend income just to keep the lights on!

That’s because even with a $1-million portfolio, you’re only getting $22,000 in dividend income a year here, on average. That’s not far above poverty-level income for a two-person household.

Pretty sad after a lifetime of saving and investing.

Luckily, there’s a way we can rake in way more dividend cash. I’m talking a steady $75,000 a year in income on a million bucks. And if you’re not a millionaire, don’t worry: a $550k nest egg will bring in $41,200 annually, enough for many folks to retire on.

That’s 59% more income than our million-dollar Aristocrat portfolio, from a nest egg that’s a little over half the size!

How to Bank an Extra $41,200 in Cash Every Year

I know what you’re thinking: “Brett, that amounts to a 7.5% yield. There’s no way a payout like that can be safe.”

You can be forgiven for thinking that, because you hear it everywhere (heck, even my financially savvy personal trainer didn’t believe payouts like this were possible).

But the truth is, there are plenty of safe payers throwing off at least that much, like the 19 stocks and funds I recommend in my Contrarian Income Report service (which I’ll show you when you click here).

Right now, these 19 sturdy investments yield 7.5%, on average. And every month I personally run each one through a rigorous dividend-safety check, starting with 3 things that are absolutely critical:

  1. Rising free cash flow (FCF)—unlike net income, which is an accounting measure that can be manipulated, FCF is a snapshot of how much cash a company is making once it’s paid the cost of maintaining and growing its business;
  2. A payout ratio of 50% or less. The payout ratio is the percentage of FCF that went out the door as dividends in the last 12 months. Real estate investment trusts (REITs) use a different measure called funds from operations (FFO) and can handle higher payout ratios, sometimes up to 90%;
  3. A healthy balance sheet, with ample cash on hand and reasonable debt.

Making DRIPs Obsolete

The best part is, these 19 investments are perfect for dividend reinvestment because each one gives us a dead-giveaway signal of when it’s time to buy, sit tight—or sell and look elsewhere for upside to go with our 7.5%+ income stream.

That makes DRIPs obsolete!

Because why would we mindlessly roll our dividend cash into a particular stock every quarter when, at a glance, we can pinpoint exactly where to strike for the biggest upside?

To show you what I mean, consider closed-end funds (CEFs), an overlooked corner of the market where dividends of 7.5% and up are common. We hold 11 CEFs in our Contrarian Income Report portfolio, mainly larger issues with market caps of $1 billion or higher.

(By the way, my colleague Michael Foster focuses 100% on CEFs in his CEF Insider service, where he keys in on funds with sub-$1-billion market caps trading at ridiculous discounts due to their obscurity. That sets you up for fast 20%+ upside and dividends up to 9.4%. You can check out a recent interview I did with Michael here.)

We don’t have to get into the weeds, but CEFs give off a crystal-clear signal that a big price rise is coming. You’ll find it in the discount to NAV, which is the percentage by which the fund’s market price trails the market value of all the assets in its portfolio.

This number is easy to spot and available on pretty well any fund screener.

This makes our plan simple: wait for the discount to sink below its normal level and make your move. Then keep rolling your dividend cash into that fund until its discount reverts to “normal.”

That’s exactly what we did with the Nuveen NASDAQ 100 Dynamic Overwrite Fund (QQQX) back in January 2017—and the results were breathtaking.

How We Bagged a 42% Total Return (With a 7.5% Yield) in 15 Months

QQQX is run by portfolio manager Keith Hembre, who cherry picks the best stocks on the NASDAQ, juices their high yields with a safe options strategy, then dishes distributions out to shareholders.

It’s hard to imagine now, after the huge run tech stocks have put in over the past couple years, but back in January 2017, QQQX was trading at a 6% discount to NAV and paid a 7.5% dividend.

That triggered our initial move into the fund. And over the next 15 months, we bagged two dividend increases and watched as QQQX’s discount swung to a massive premium—so much so that by the end of that period, the herd was ready to ante up $1.13 for every buck of assets in QQQX’s portfolio!

Discount Window Slams Shut…

That huge swing from a discount to a premium catapulted us to a fat 42% gain (including dividends). But the fund’s outrageous premium meant its upside was pretty well maxed out by the time we took our money off the table on April 6, 2018.

… and Delivers a Fast 42% Gain

And what’s happened since?

QQQX has moved up slightly—a 1% gain. But that’s way behind the market, which has cruised to a 7.5% rise.

Premium Gives Us the Perfect Exit

Forget QQQX: Grab These 8% Monthly Dividends Instead

Luckily, the herd has cooled a bit on QQQX, but it still trades at a 5% premium to NAV. And why the heck would we overpay when the ridiculously inefficient CEF market is throwing us bargain after bargain as I write this?

And there’s one more thing I have to tell you: many of these cheap CEFs pay dividends monthly instead of quarterly.

So if you hold them in your retirement portfolio, their massive dividend payouts will roll in on exactly the same schedule as your monthly bills!

Convenience isn’t the only reason to love monthly payers, though. Because they also let you reinvest your payouts faster, amplifying your gains (and income stream) as you do.

I’m talking about an automatic “set-it-and-forget-it” CASH machine here!

  [FREE REPORT] Options Income Blueprint: 3 Proven Strategies to Earn More Cash Today Discover how to grab $577 to $2,175 every 7 days even if you have a small brokerage account or little experience... And it's as simple as using these 3 proven trading strategies for earning extra cash. They’re revealed in my new ebook, Options Income Blueprint: 3 Proven Strategies to Earn Extra Cash Today. You can get it right now absolutely FREE. Click here right now for your free copy and to start pulling in up to $2,175 in extra income every week.